If there’s one thing I’ve learned over the years, the stock market is as punishing as it is rewarding. If you’re prepared, you’ll reap the rewards and incur losses if you move in haste.
Most traders within our Zeiierman Trading community will attest to this. You can have all the ambition in the world, but without the right tools and strategies, the market has a way of humbling even the most confident traders. Trust me, I am not bragging – rather speaking from personal experience.
As we head into 2025, the game is only getting tougher. Retail traders are smarter, institutions are faster, and volatility is the norm. To survive—nay, to thrive—you need more than gut instinct or guesswork. You need precision. You need insights.
And most importantly, you need indicators that don’t just tell you what’s happening—they help you predict what’s coming next.
Over the years, I’ve tested hundreds of indicators. Some were brilliant, others… not so much. As such, I made our own indicators with SM_Trader here at Zeiierman Trading.
1) Arcturus Algo
I’ll be honest—Arcturus Algo is the trader’s cheat code. It’s more than just an indicator; it’s a bot that does the heavy lifting for you.
Arcturus Algo is a sophisticated trading algorithm that adapts to various market conditions. Imagine having a tool that doesn’t just point out opportunities but also automates your strategy to execute trades precisely. That’s Arcturus Algo in a nutshell.
This algorithm is designed to adjust its parameters based on recent market activity. It uses a weighting function to prioritize recent volatility and price changes, improving the overall signal responsiveness.
Arcturus Algo also uses historical data and a weighted Average True Range (ATR) function to predict future support and resistance areas.
Insights Provided: It generates signals when a new trend (or reversal) is detected.

Arcturus Algo is a fully automated stock trading bot designed for precision and performance. Tailored specifically for the stock market, it boasts a win rate exceeding 80%, as demonstrated in the chart, showcasing its accurate buy and sell signals and consistent profitability. A powerful solution for traders seeking reliable and efficient results.
Check out Zeiierman Trading’s Arcturus Algo indicator.
2) WaveTrend Momentum
I’ve found this one to be a lifesaver in flakey markets. Instead of chasing every move, WaveTrend helps you focus on the trades that actually matter.
WaveTrend Momentum is a fast-moving, sensitive oscillator that reacts quickly to price changes. Ours analyzes price action and filters out the noise to accurately read the strength and momentum of the current trend.
The height of WaveTrend histogram represents the strength of the current price move. Primarily, we use the WaveTrend momentum to identify divergences and impulses before making any buy/sell decisions.
Insights Provided: By analyzing momentum shifts, WaveTrend highlights opportunities to enter or exit positions during temporary retracements or continuations. You also get visual cues when the market is in extreme conditions (overbought and oversold).
Check out Zeiierman Trading’s WaveTrend Momentum indicator.
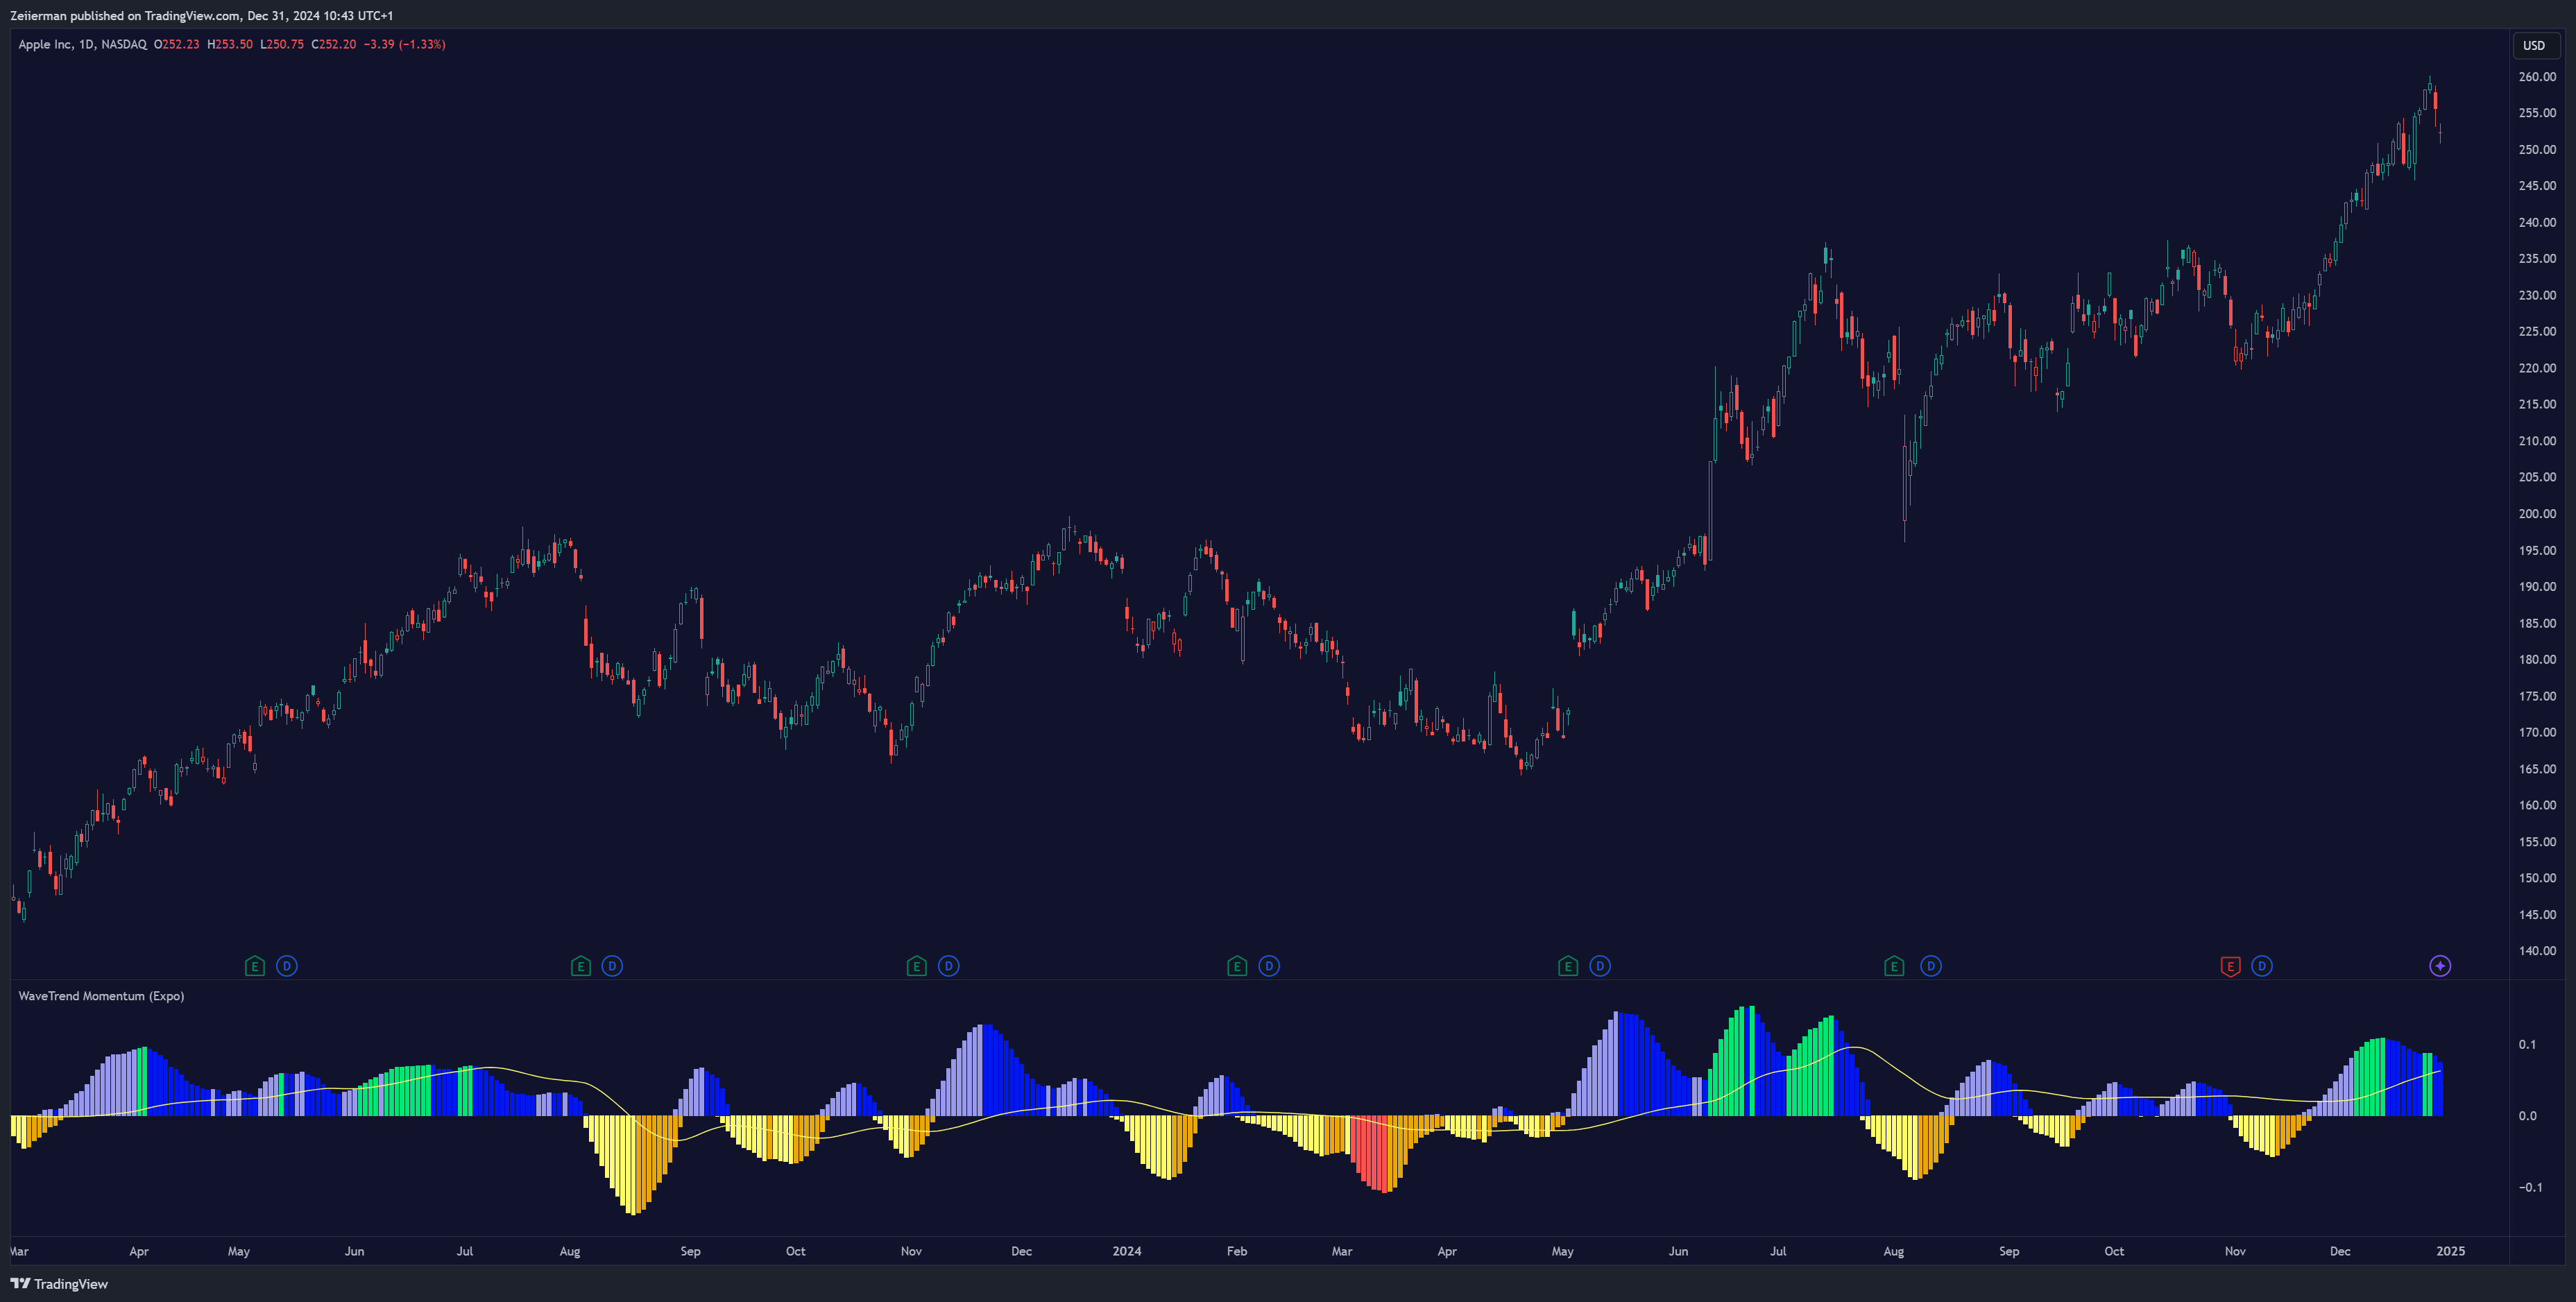
The image showcases the WaveTrend Momentum Oscillator, a versatile tool for analyzing market momentum and trends. The chart demonstrates its effectiveness in detecting overbought and oversold conditions, with precise signals that align with key price movements. Additionally, it excels as a trend-following tool, helping traders identify and ride strong market trends. This makes it an essential asset for both scalping and swing trading strategies.
3) Range & Trend
The name says it all—Range & Trend is your go-to indicator when trying to make sense of volatile markets. It uses a combination of trend analysis and range detection to highlight potential buy and sell signals.
For an experienced trader, it gives you more than Buy/Sell signals – it highlights when to hold strong and when to jump ship. Trust me, this can make all the difference between riding a big winner and jumping out too early.
And the best part? It’s one of the simplest indicators to read and use. There are no fluff or overcomplicated charts—just clear signals to help you trade with confidence.
The primary visual is the Range & Trend line that indicates direction and strength of current market strength. Next, you get additional components such as a trend tracker to measure volatility and momentum (fast vs slow) and insights into potential swing points of a trend line.
Insights Provided: I use Range & Trend indicators primarily for trend confirmation. It is best used in conjunction with other indicators to help verify potential trends or reversals.
Check out Zeiierman Trading’s Range & Trend indicator.
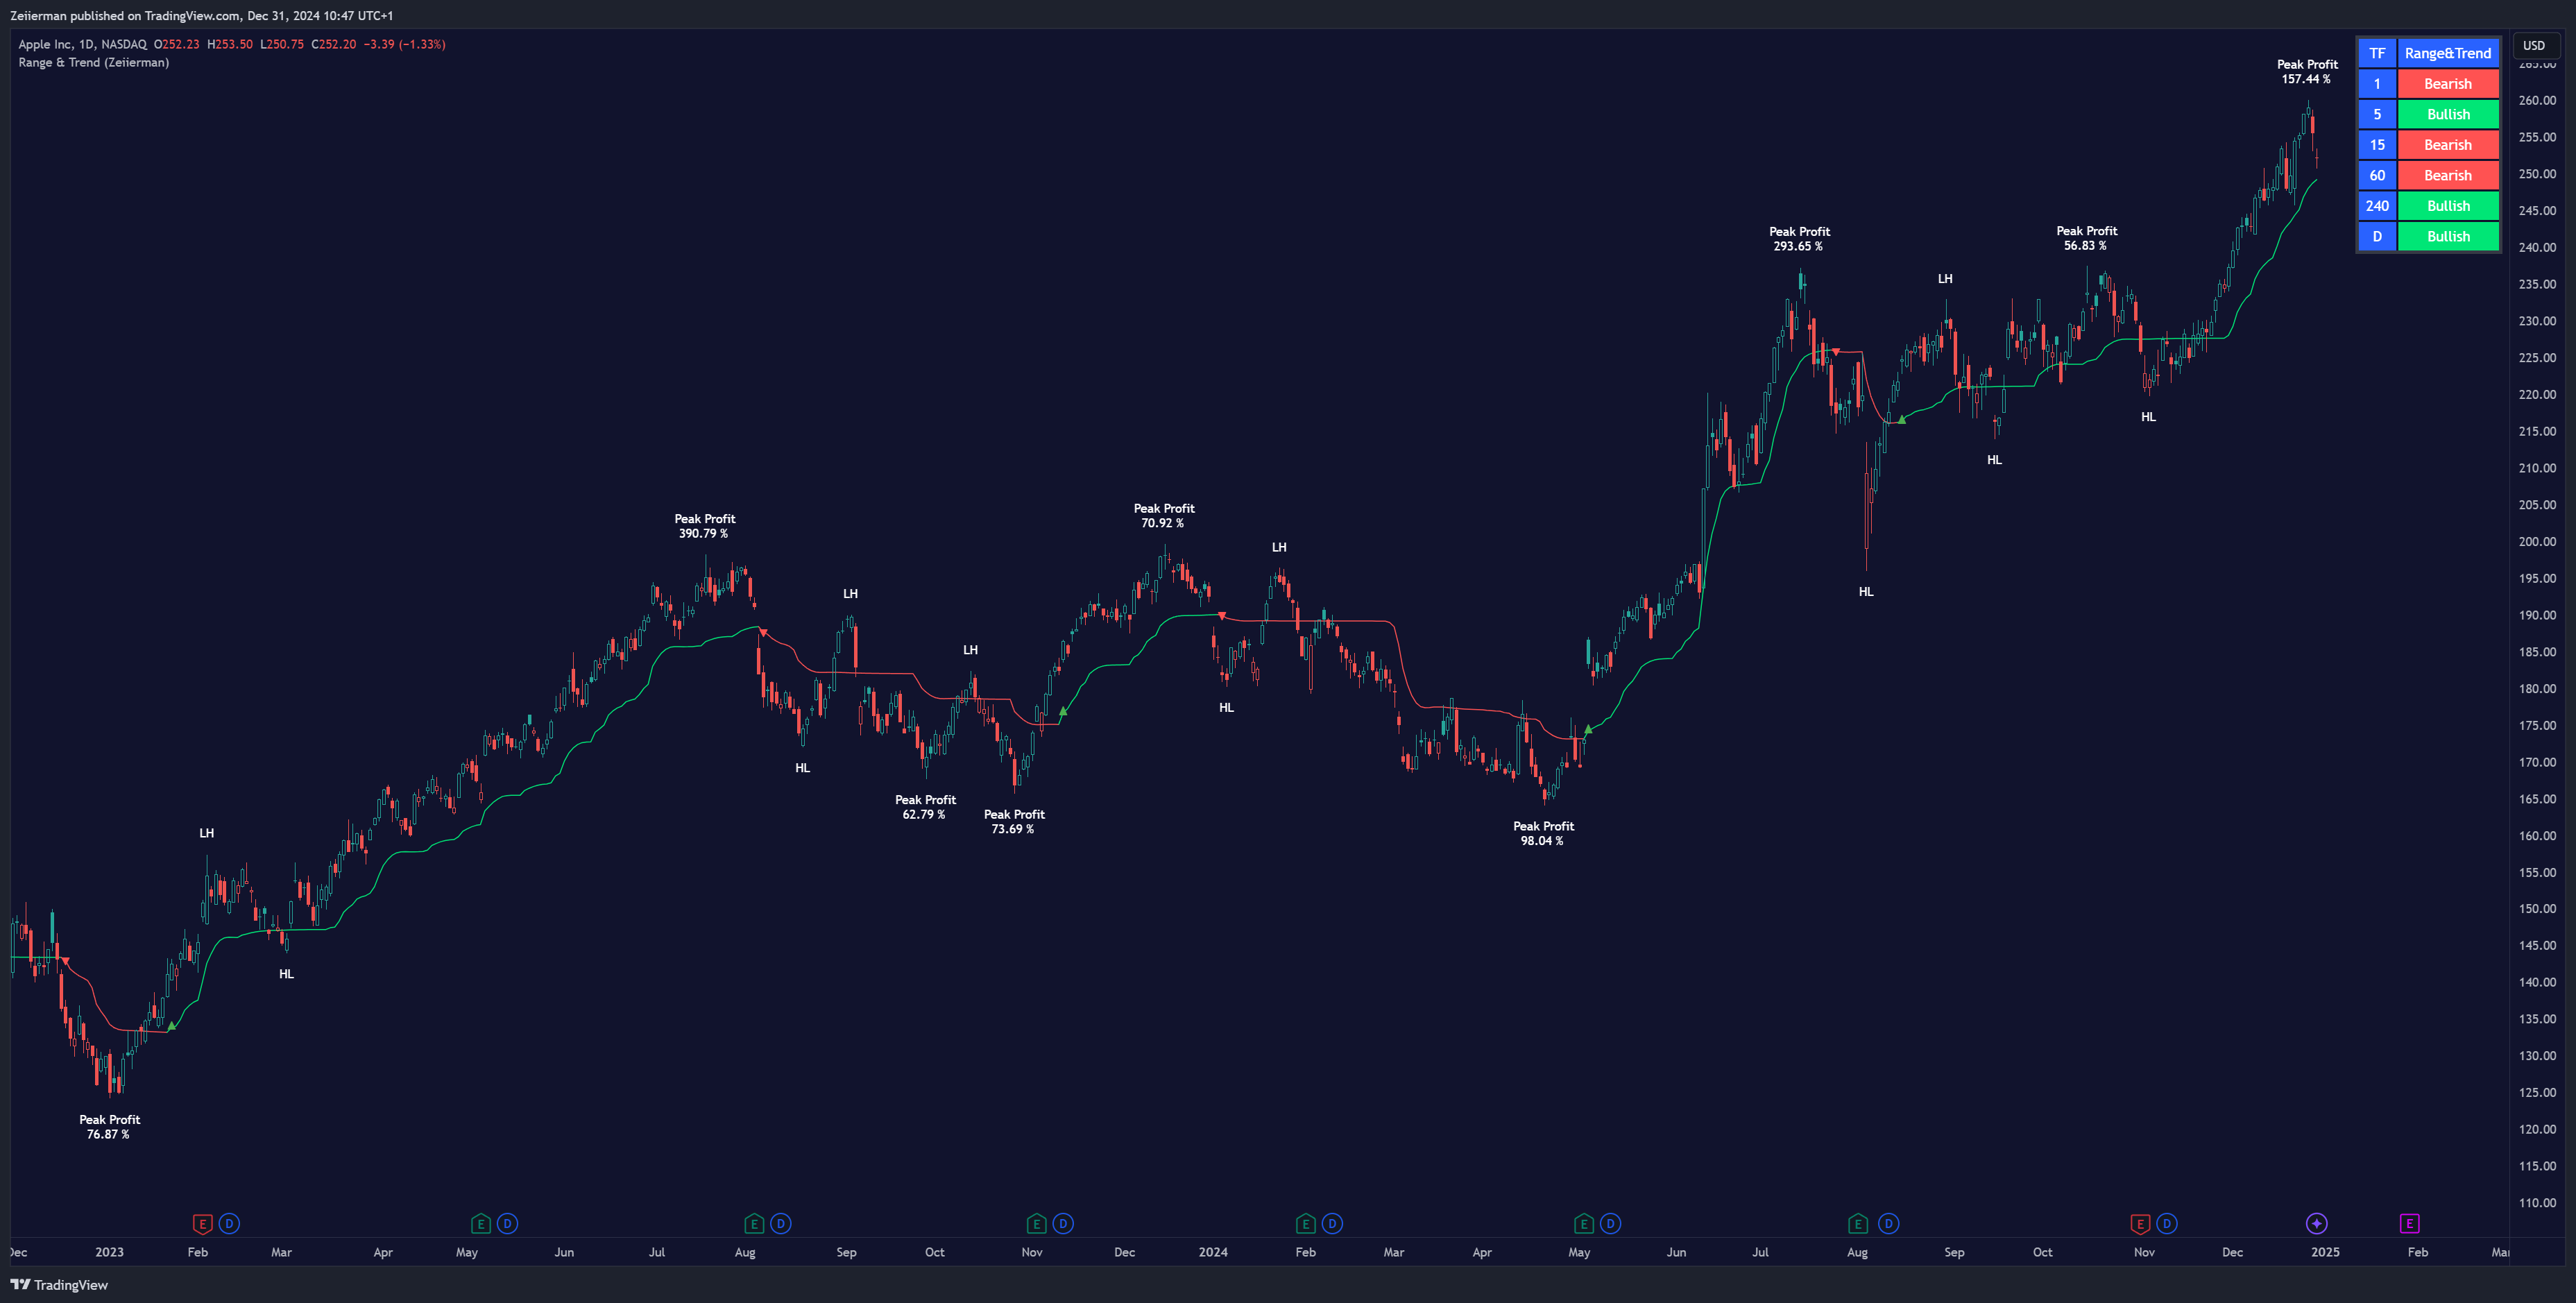
The chart showcases the Range and Trend indicator by Zeiierman, a comprehensive tool for identifying price trends and key market levels. The indicator effectively highlights trend direction, peak profit opportunities, and price ranges, making it ideal for both trend-following and range-bound strategies. In the chart, it demonstrates clear bullish and bearish trend shifts, supported by profit percentages, helping traders make informed decisions with confidence. An excellent choice for traders seeking clarity in market movements and actionable insights.
4) Momentum Trend Strategy
Breakouts are where the real money is made, and the Momentum Trend Strategy is a game-changer for spotting them early.
The Momentum Trend Strategy analyzes price momentum to detect surges and indicate upcoming moves. Notably, it filters out the noise and focuses only on high-probability trend signals.
Personally, I’ve found Momentum Trend Strategy to be incredibly reliable in fast-moving markets. Pair it with strong risk management, and you’ll see how it transforms your approach.
The Momentum Trend Strategy is perfect for traders who want to stay ahead of the market curve and focus on high-impact opportunities. With this, you get to spot and capitalize on breakouts faster than ever.
And you get momentum confirmation to pair with the Range & Trend indicator.
Check out Zeiierman Trading’s Momentum Trend Strategy indicator.
Characteristics of Breakout Trading Systems: Win-Rate and Risk-Reward
Win-Rate in Breakout Trading: The win-rate of breakout trading systems varies widely and is influenced by several factors including market conditions, the asset being traded, and the trader’s skill in identifying genuine breakouts versus false breakouts.
Typically, breakout strategies might have a win-rate ranging from 30% to 50%, which may seem low but can still be profitable due to the risk-reward ratio employed in such strategies.
Risk-Reward Ratio: Breakout trading strategies often aim for a favorable risk-reward ratio to compensate for the lower win-rate. A common risk-reward ratio in breakout trading is 1:2 or higher, meaning for every dollar risked, the target is to make two dollars. This ratio ensures that even if the win-rate is below 50%, the overall Strategy can still be profitable.
This image illustrates how important the risk-reward ratio is in breakout trading. Make sure to always aim for at least 1:2, but in these kinds of strategies, we can aim for much higher ratios.
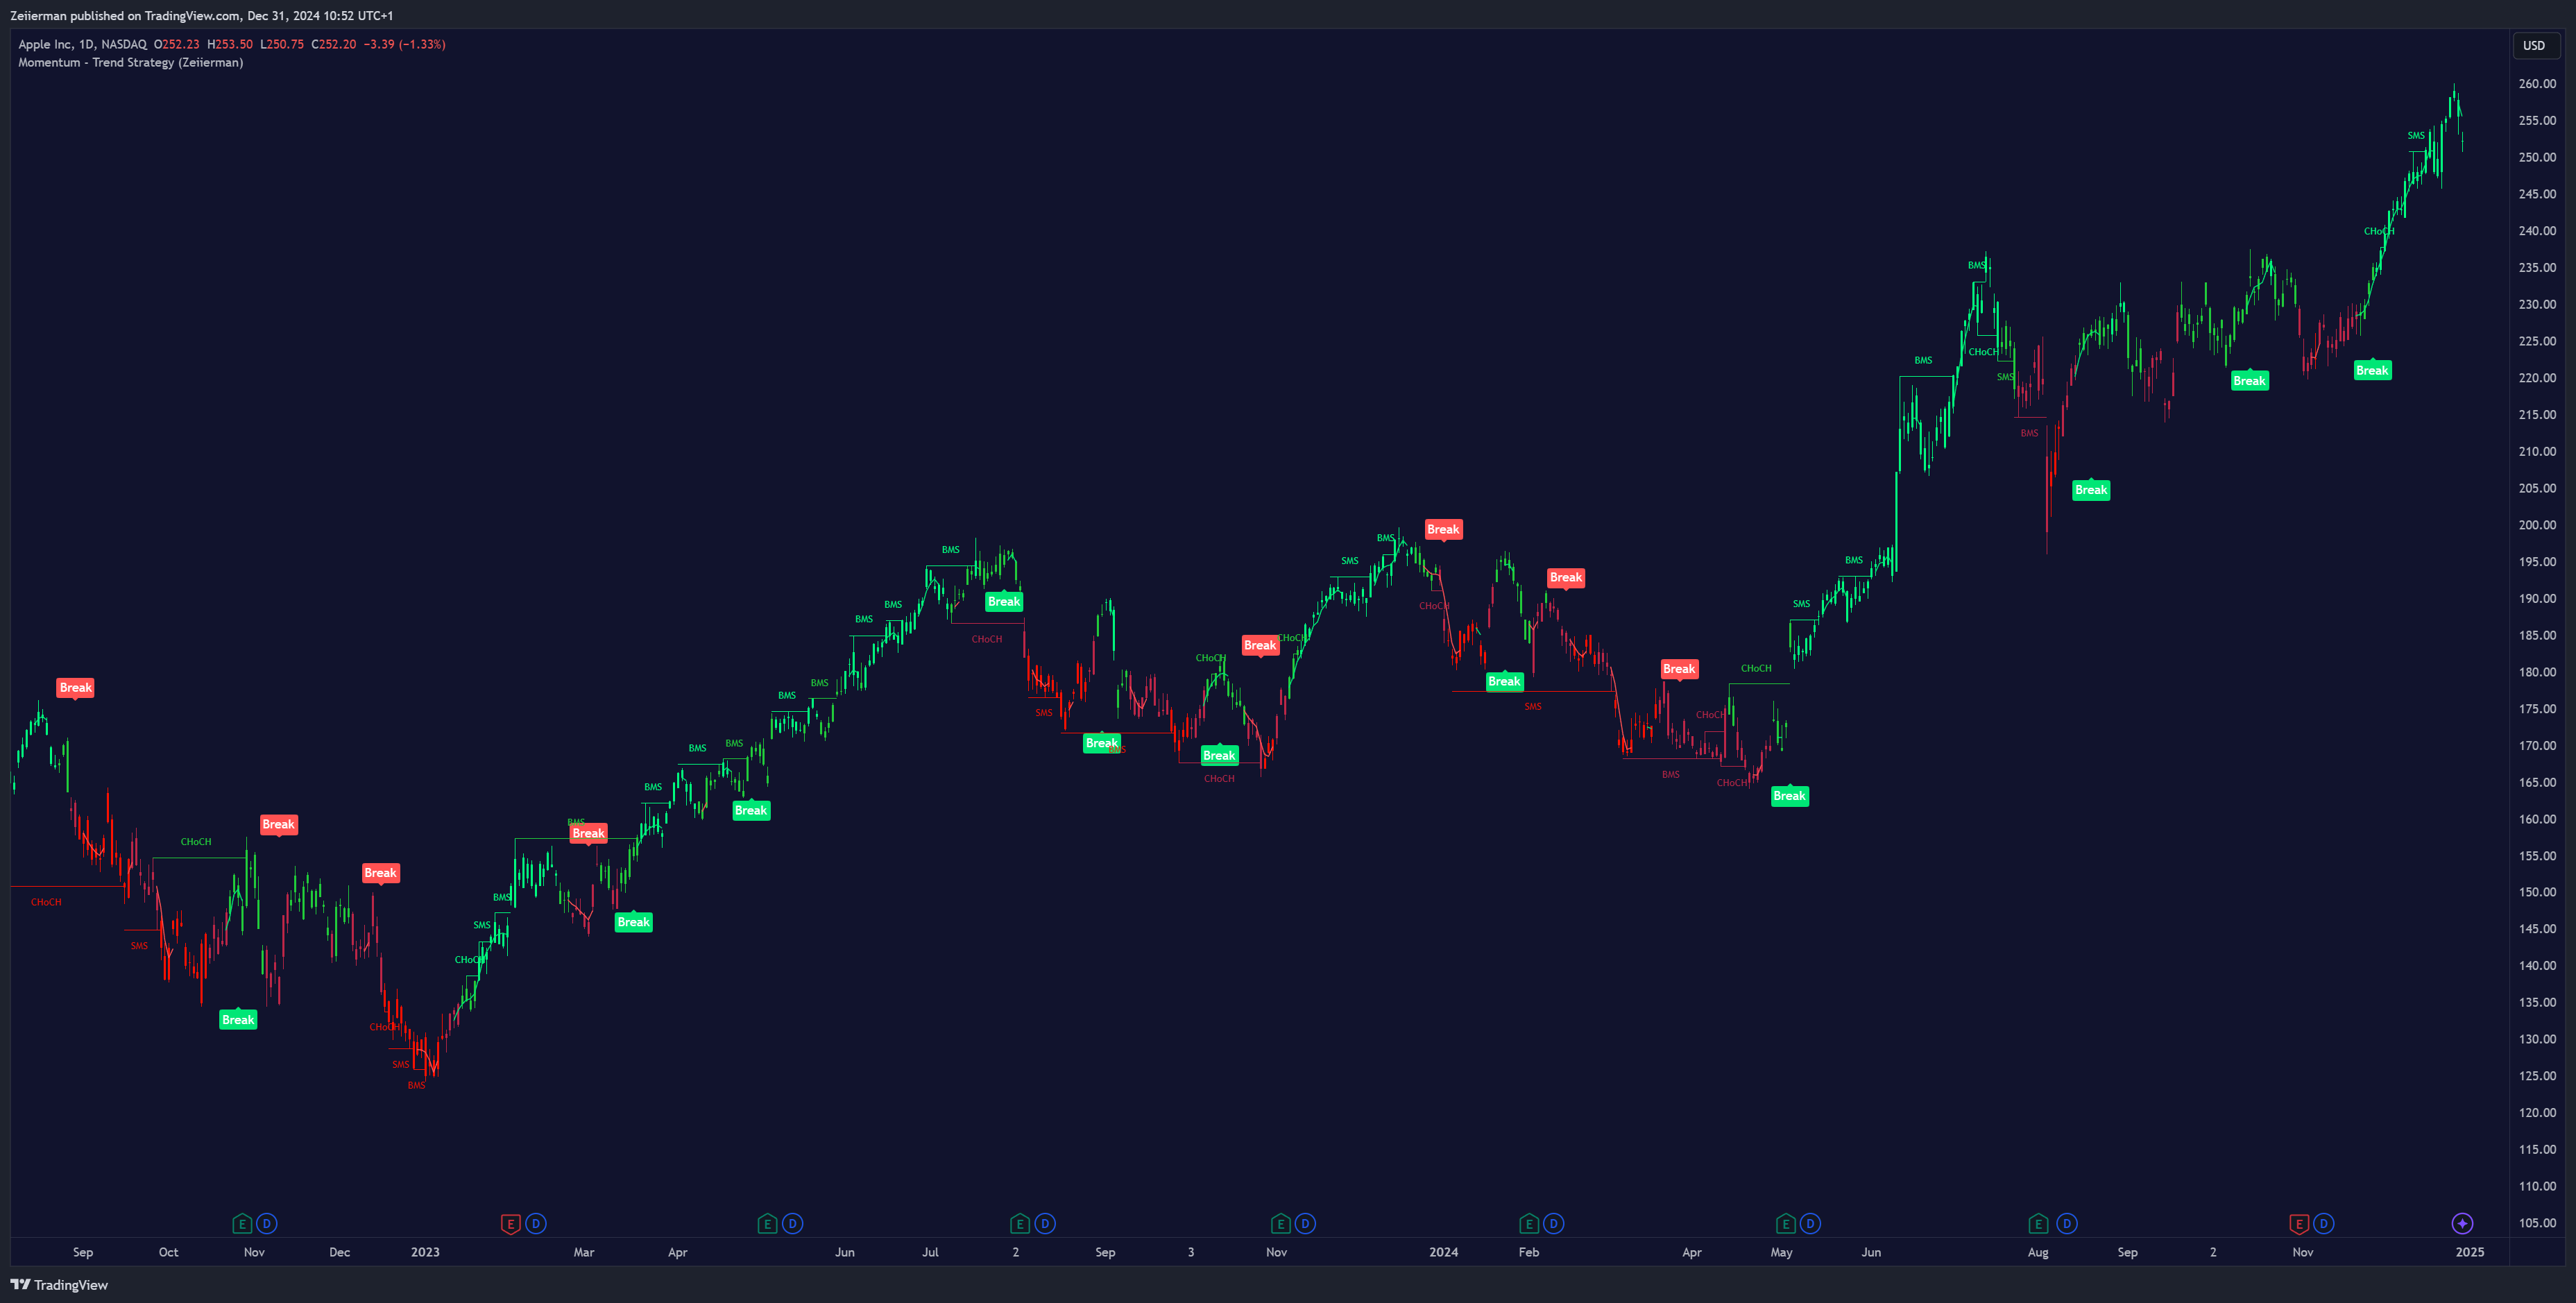
This Strategy leverages all key aspects to make breakout trading both easy and profitable. Breakout signals are based on momentum and internal market structure. These signals confirm strong momentum in the market, often referred to as Momentum Breakouts.
This typically leads to a break in market structure, further validating the Momentum Breakout signal. By combining these elements, traders can achieve higher win rates and substantial gains, while reducing the likelihood of false breakouts. This integrated approach not only enhances the accuracy of trades but also improves the overall trading experience by aligning with the behavior of institutional investors and market trends.
5) Timely Opening Range Breakout Strategy
This is the perfect indicator if you dabble in day trading. Why? Because the opening range often sets the tone for the rest of the trading day.
With Timely Opening Range Breakout Strategy (TORB), we help make sure you don’t miss out on this critical window of opportunity. It’s like having a morning routine that consistently delivers results—structured, reliable, and rewarding.
TORB is not flashy but backed by years of research and proven success. If you’re looking for a systematic way to trade the opening bell, this is it.
The TORB indicator calculates the day’s opening range and identifies breakouts beyond those levels. It also helps with direction bias – figuring out whether the market will likely trend bullishly or bearishly after defining the opening range.
Check out Zeiierman Trading’s Timely Opening Range Breakout Strategy indicator.
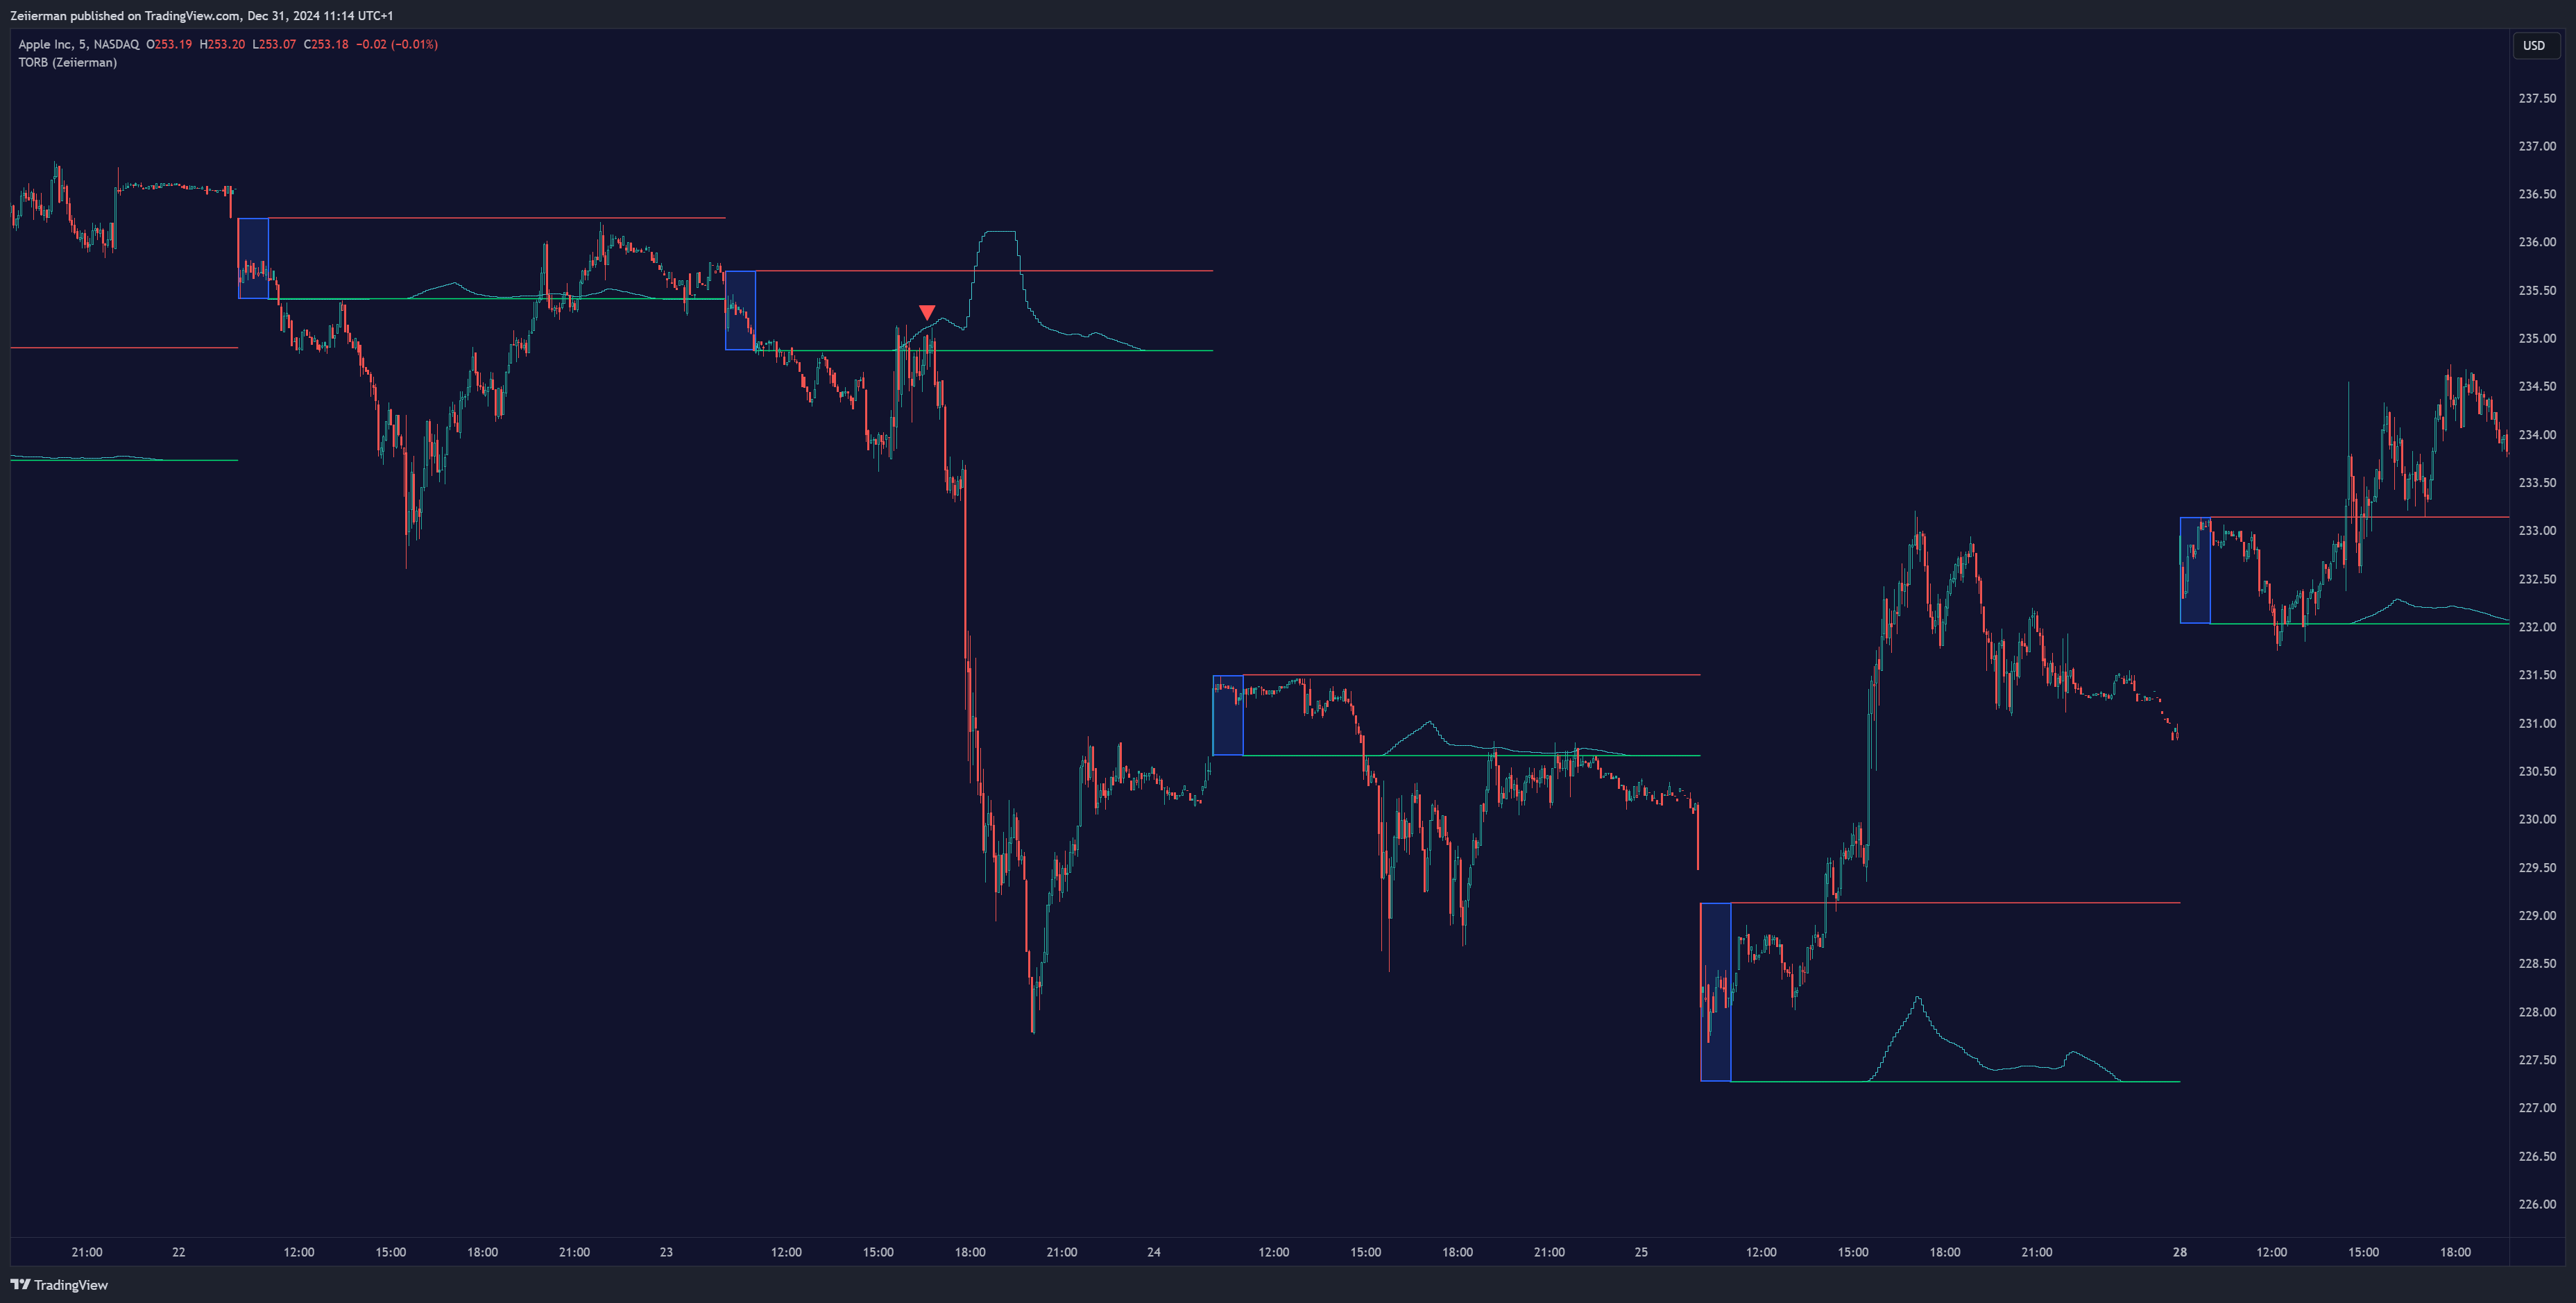
As we can see in this graph, the opening range is plotted along with the market activity. Breakouts occur only if there is enough market activity at the same time as the breakout happens, which enhances the accuracy of the strategy. This indicator can only be used on lower timeframes such as 15 minutes and below.
6) Analyst Table
It’s always smart to see what the experts say when in doubt. That’s exactly what the Analyst Table delivers—a consolidated view of top analysts’ opinions, price targets, and stock ratings.
I made this tool to make sure I don’t get too much into my own head. And this was a good and systemic way to validate my own analysis.
If I’m bullish on a stock and the analysts agree, it adds a layer of confidence to my trade. Conversely, if their targets contradict my expectations, it’s a cue to dig deeper or reconsider my approach.
In the Analyst Table, you get detailed stock ratings and decisions from top traders including buy, hold, or sell recommendations. With enough experience under your belt, you can also gauge market sentiment just from the Analyst Table indicator.
The Analyst Table is a must-have for traders who want to align their strategies with institutional perspectives or gain a deeper understanding of market sentiment.
Check out Zeiierman Trading’s Analyst Table indicator.
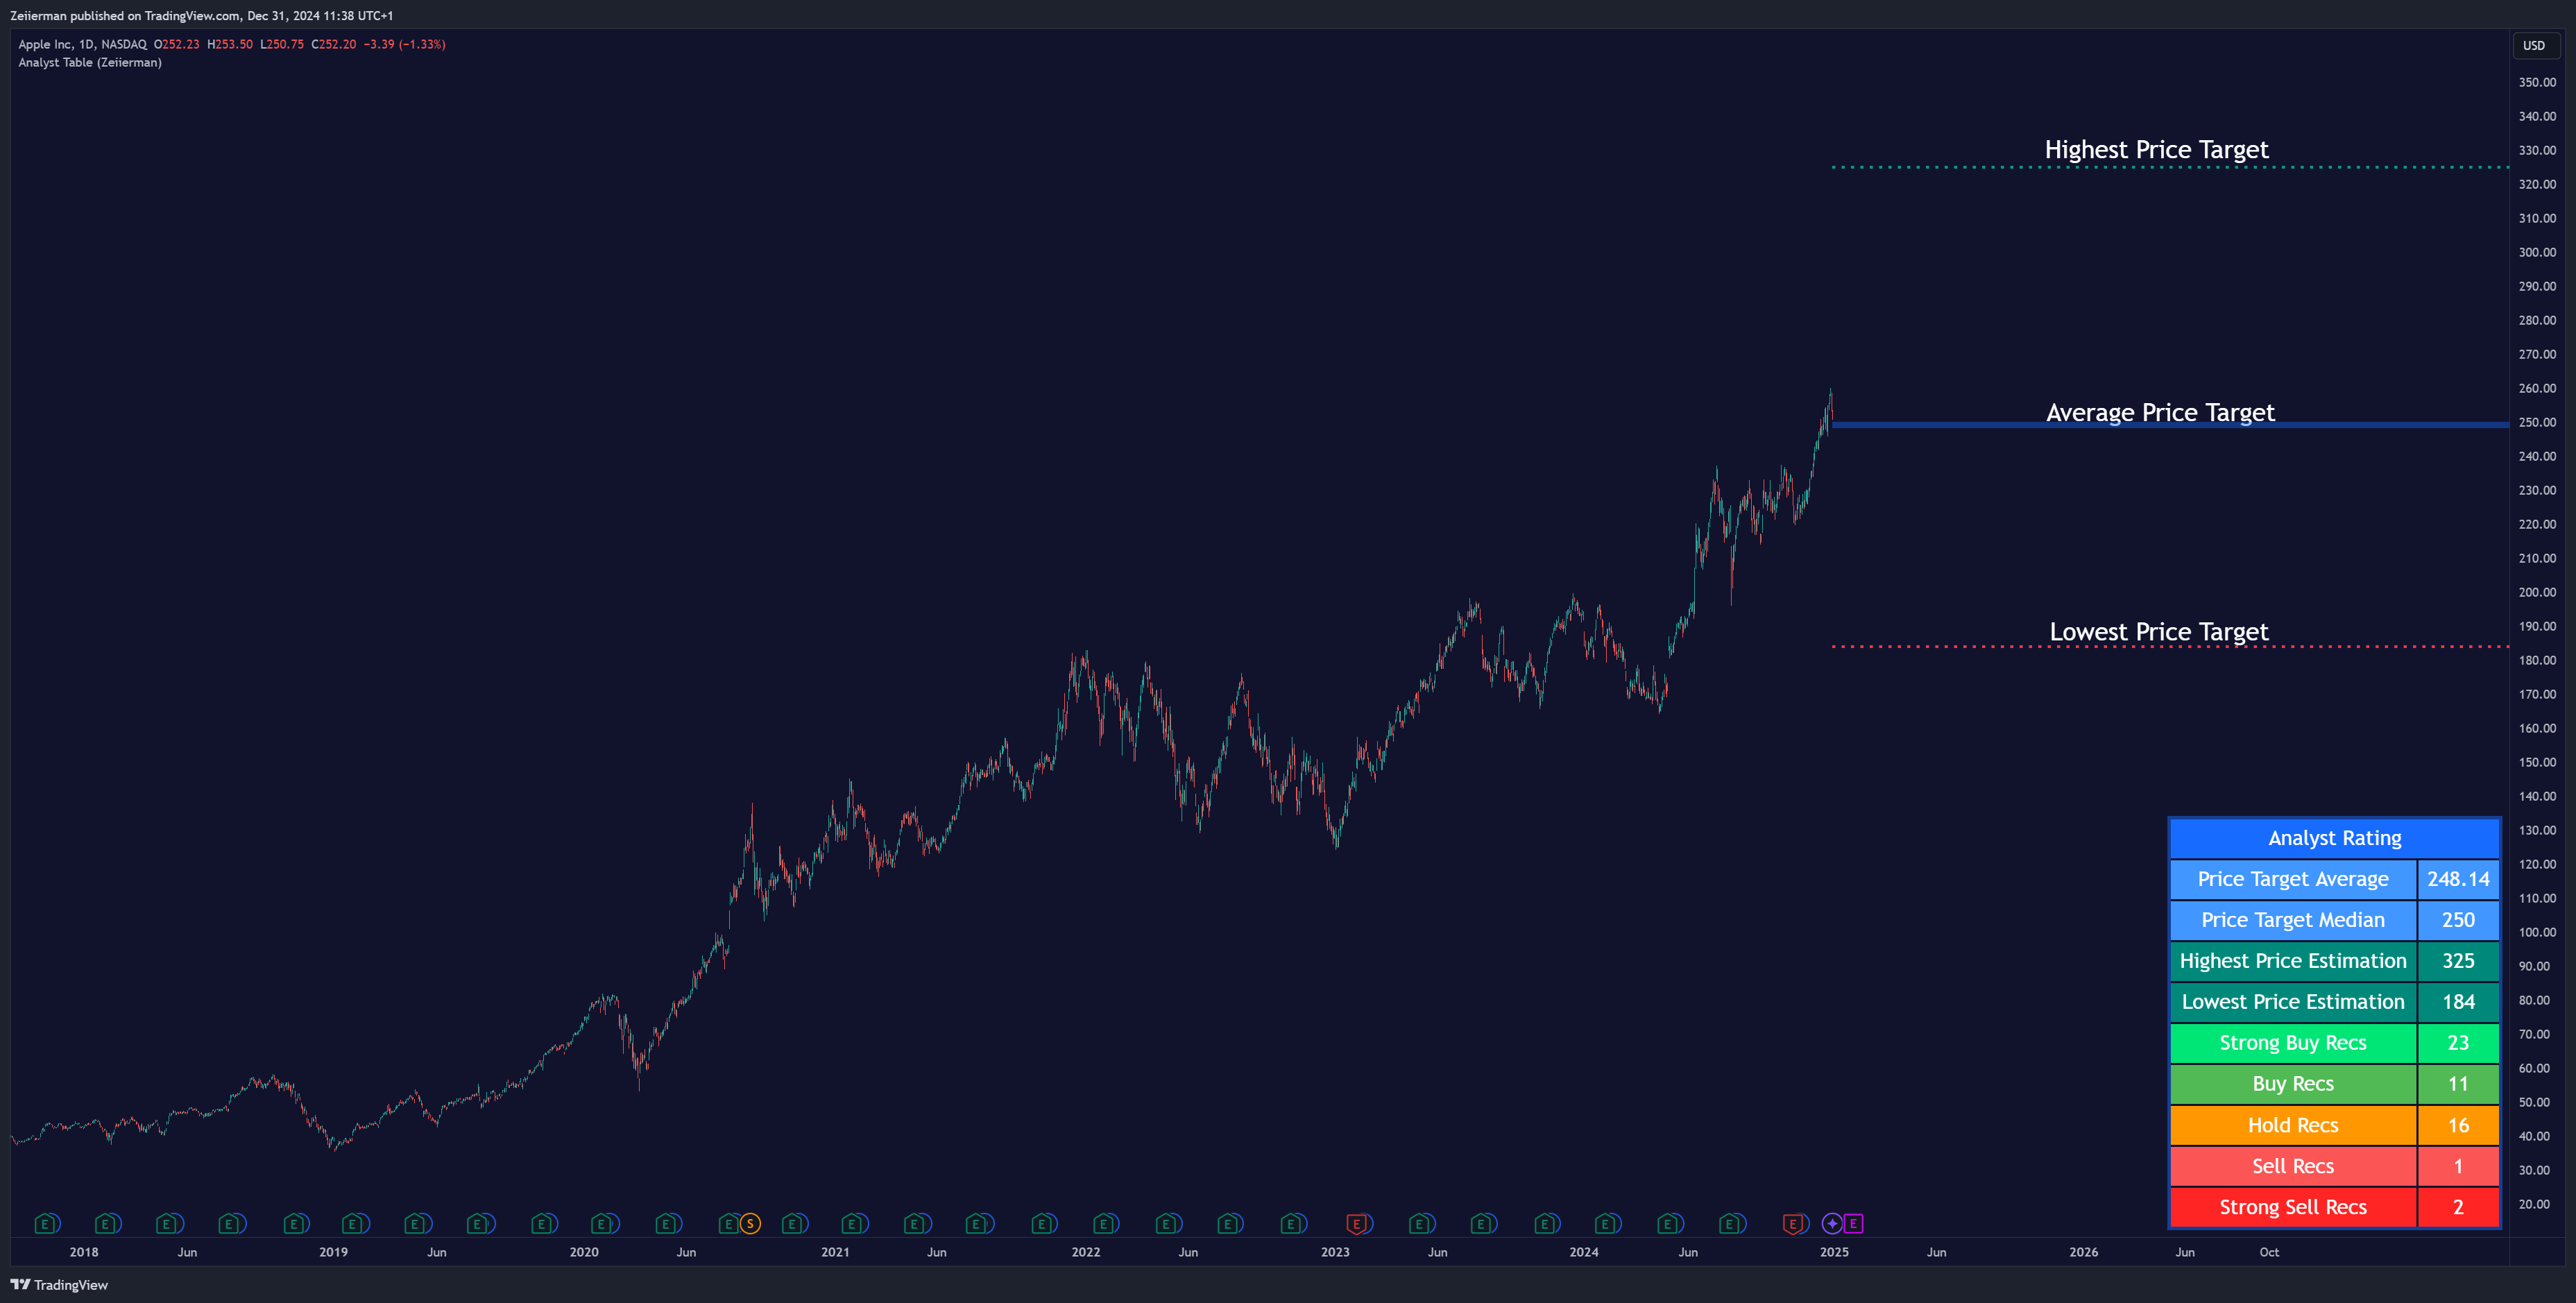
The image presents the Analyst TableIndicator, which aggregates analyst price targets and recommendations into a clear, visual summary. It shows key metrics such as the average and median price targets, the highest and lowest estimations, and the distribution of recommendations (e.g., strong buy, buy, hold, sell, and strong sell).
This indicator provides traders and investors with a quick overview of market sentiment and professional analyst expectations, making it an excellent tool for informed decision-making in stock trading.
7) Optimal Buy Day
Imagine knowing the statistically best day of the month to buy stocks for maximum returns—sounds like a dream, right? Zeiierman’s Optimal Buy Day turns that dream into reality by using historical data to identify patterns and give you actionable insights.
It’s not just about when to buy—it’s about optimizing every dollar you invest to work harder for you. As such, I often use it for making my long-term trading decisions.
The Optimal Buy Day uses statistical analysis of market trends to calculate which days typically deliver the best returns. It’s perfect for traders and investors looking to plan their entries precisely.
The Optimal Buy Day indicator is ideal for investors who want to maximize their returns over the long term without relying on guesswork. In lay terms, it helps you avoid buying too early or too late in the month.
Check out Zeiierman Trading’s Optimal Buy Day indicator.
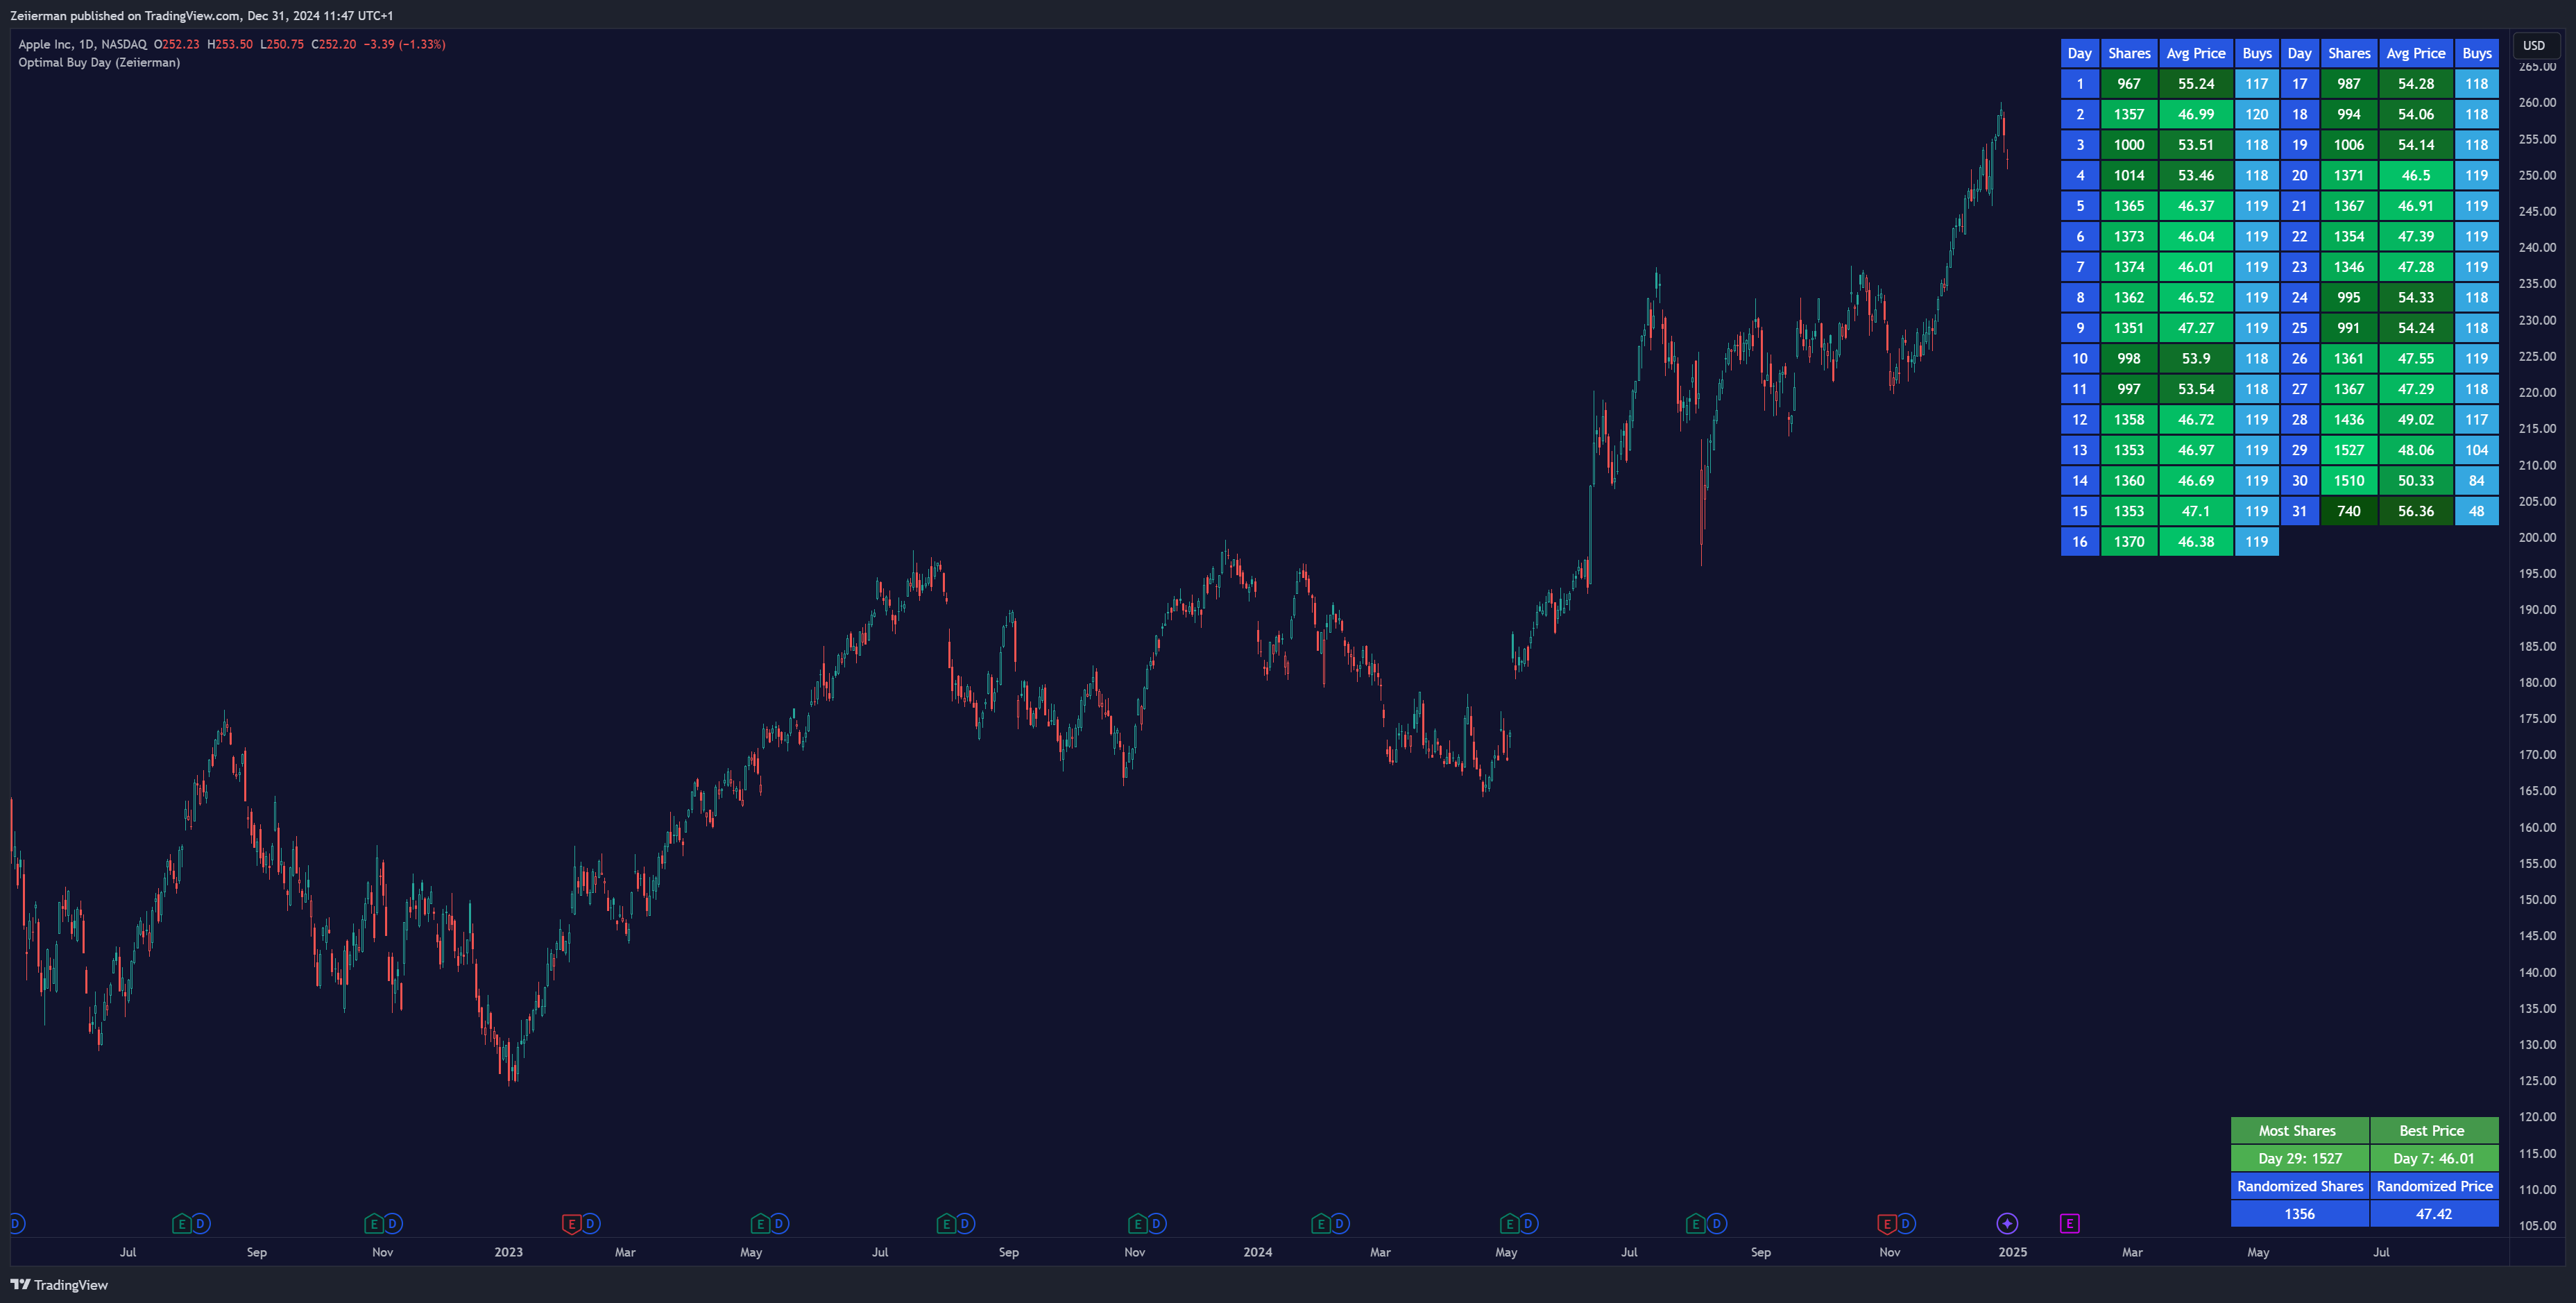
The chart highlights the Optimal Buy Day indicator by Zeiierman, focusing on identifying the most strategic days for purchasing based on historical data and price activity. The table in the lower-right corner provides detailed insights, such as the day with the most shares bought (Day 29: 1527 shares) and the best price achieved (Day 7: $46.01).
This data-driven approach helps traders maximize efficiency by optimizing entry points, leveraging clear visual metrics to support informed decision-making. An invaluable tool for traders aiming to refine their strategies.
8) Dividend Calendar (Editors Pick on TradingView)
This is a prime example of how we make a trader’s life easier at Zeiierman Trading.
Tracking dividend payouts across multiple stocks can be a headache. This tool simplifies the process, helping you estimate your income and plan your investments more effectively.
I’ve always believed dividends are a fantastic way to build wealth over time, and this indicator makes the process even smoother. Whether building a portfolio for passive income or reinvesting dividends for compounding growth, the Dividend Calendar is your ally.
The Dividend Calendar aggregates key dividend information, providing insights into payment dates, expected payouts, and overall portfolio yield.
Check out Zeiierman Trading’s Dividend Calendar indicator.
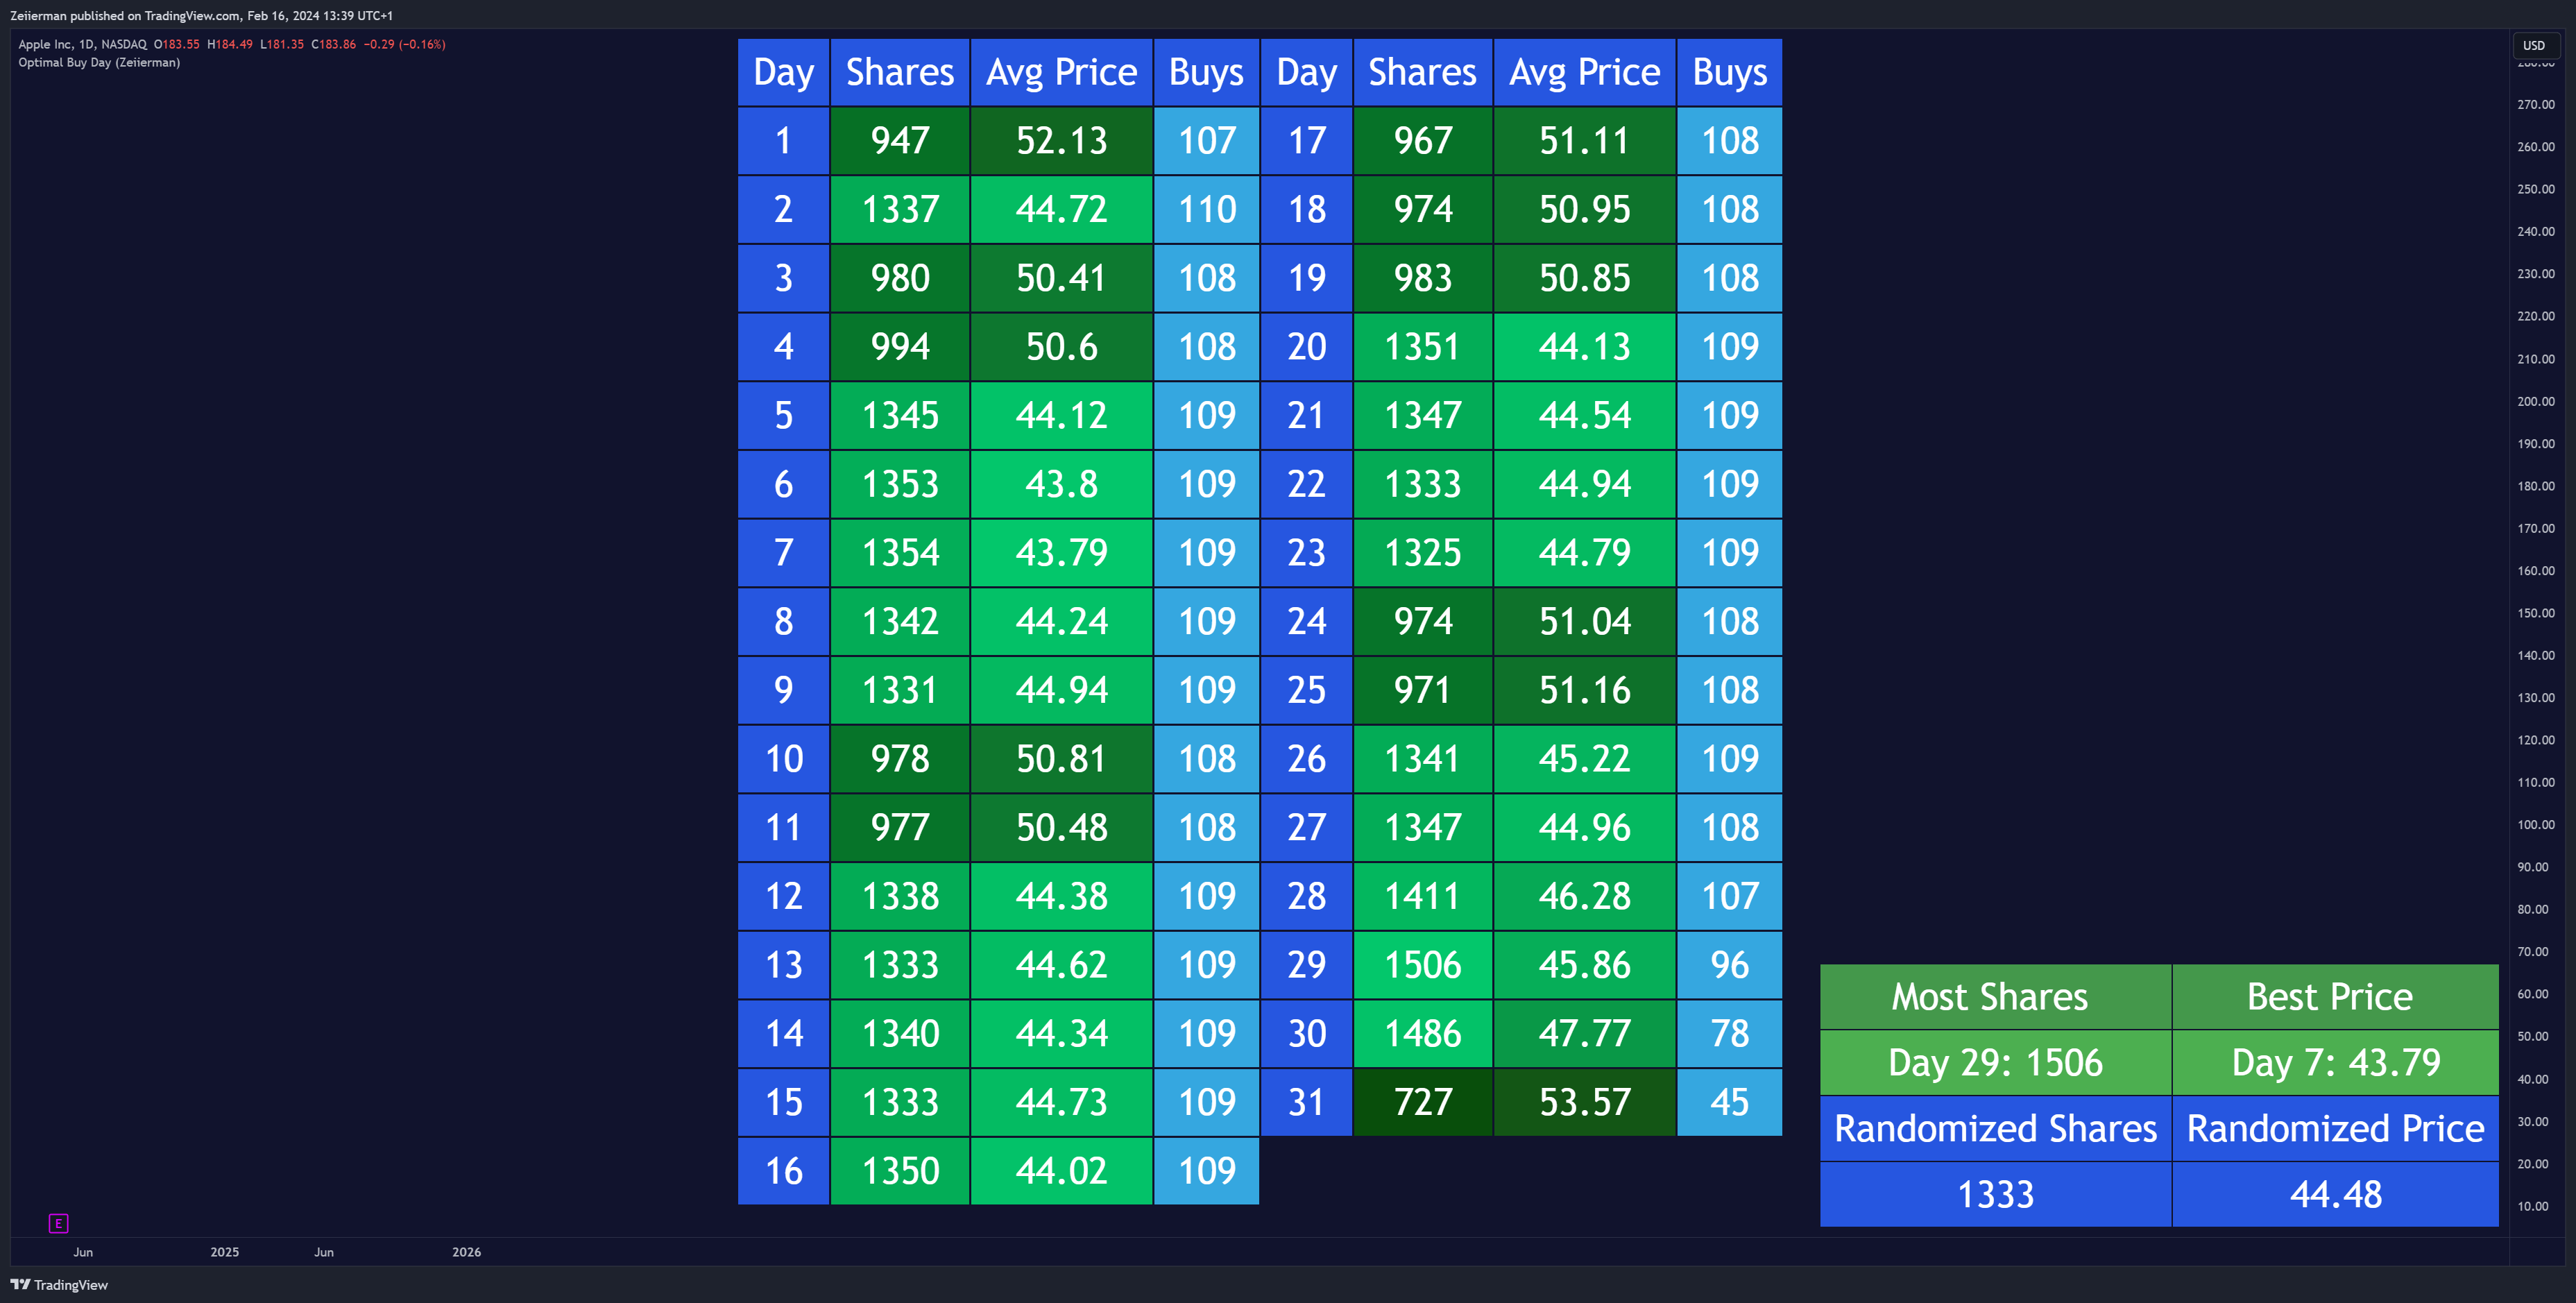
The chart highlights the Optimal Buy Day indicator by Zeiierman, focusing on identifying the most strategic days for purchasing based on historical data and price activity. The table provides detailed insights, such as the day with the most shares bought (Day 29: 1506 shares) and the best price achieved (Day 7: $43.79). This data-driven approach helps traders maximize efficiency by optimizing entry points, leveraging clear visual metrics to support informed decision-making. An invaluable tool for traders aiming to refine their strategies.
9) Fear and Greed Index
Markets run on emotions—fear and greed…sometimes When fear takes over, traders sell in a panic. When greed dominates, we tend to chase rallies.
Zeiierman’s Fear and Greed Index is designed to measure these emotions, giving you a clear picture of market sentiment so you can act rationally when others don’t.
This indicator has been a staple in my toolkit. It’s helped me avoid chasing overbought markets and taught me to embrace opportunities when fear peaks. Trust me, some of the best trades come when the market is scared out of its mind.
This indicator is mostly used for risk assessment and signal validation but there’s another amazing use. Finding contrarian opportunities. Fear and Greed Index identifies when the market is irrationally fearful or greedy, creating trading opportunities.
Check out Zeiierman Trading’s Fear and Greed Index indicator.
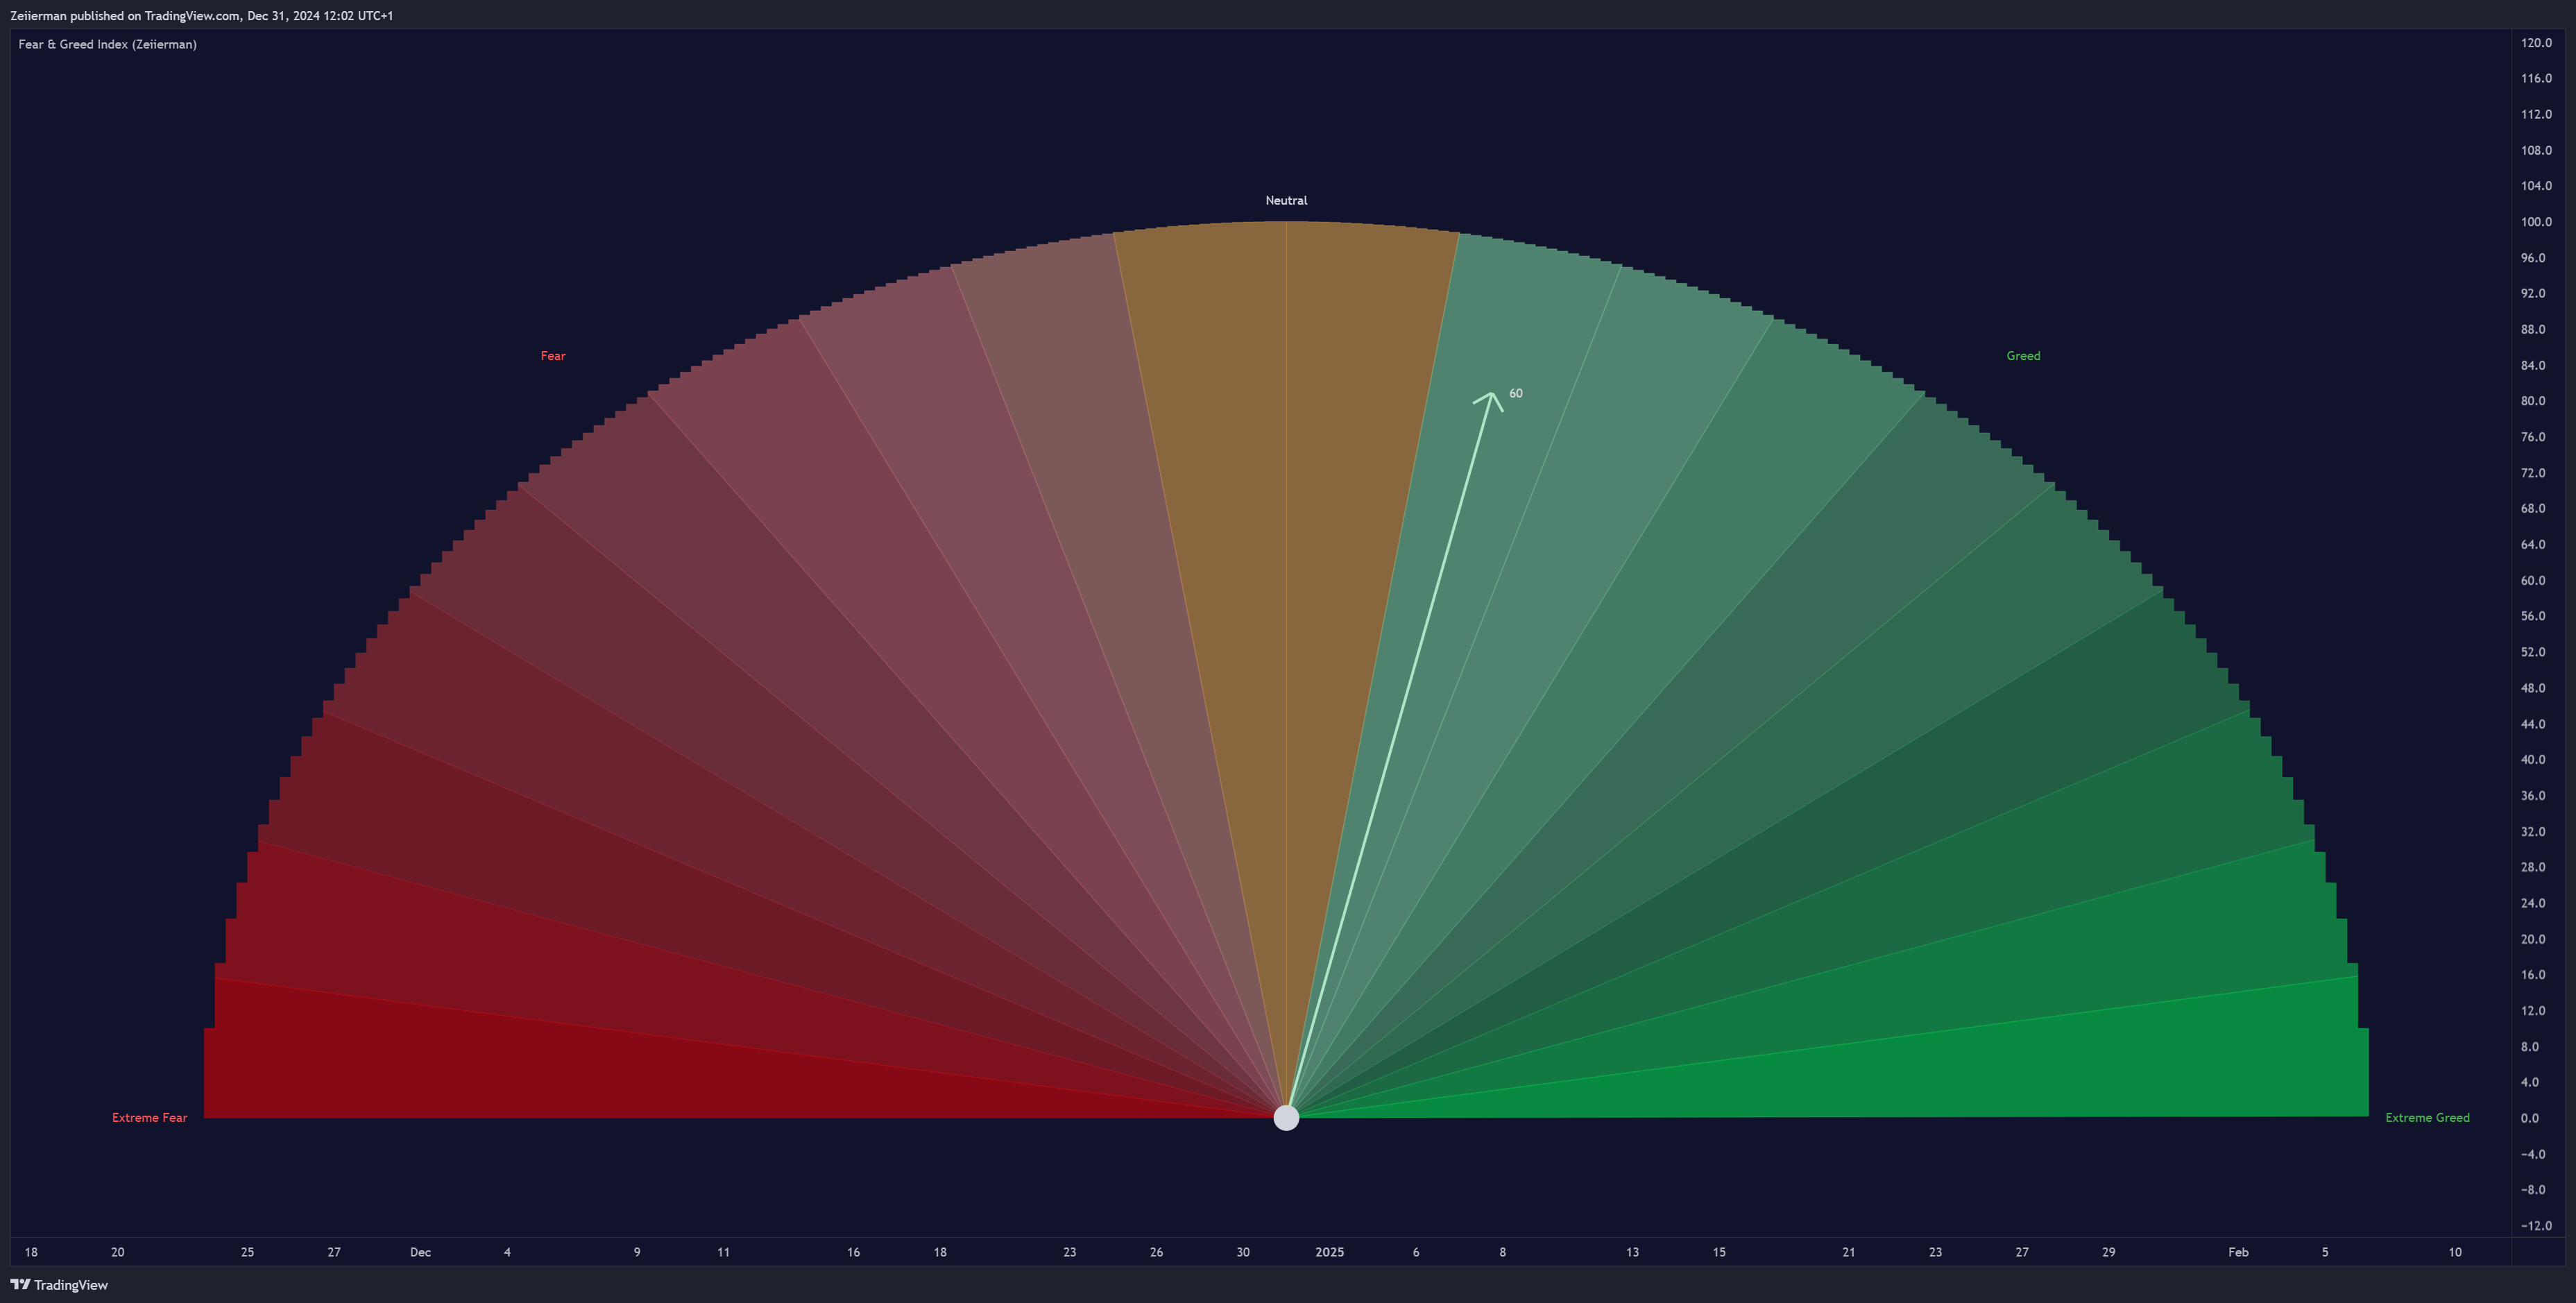
The chart showcases the Fear & Greed Index by Zeiierman, a visual tool designed to measure market sentiment. The semi-circular gauge ranges from Extreme Fear on the left (red) to Extreme Greed on the right (green), with a neutral zone in the middle.
The needle is currently pointing at 60, placing it in the “Greed” zone, indicating that the market is leaning toward optimistic or overbought conditions. This index helps traders assess the emotional state of the market, making it easier to identify potential turning points, such as when extreme greed might signal a correction or extreme fear might suggest a buying opportunity. An essential sentiment analysis tool for informed trading decisions.
10) Gap Statistics
Gaps in the market may seem confusing, but they’re incredibly lucrative when paired with experience and the right tools.
The Gap Statistics indicator is built to decode the mystery of gaps, offering data on their size, likelihood of being filled, and the opportunities they present.
I’ve always seen gaps as windows of opportunity, but timing and context are everything. This tool makes sure you’re not guessing. We made sure you get the hard data needed to make informed decisions.
Whether you’re trading pre-market gaps or intra-day setups, this indicator is your guide.
Gap Statistics is perfect for traders who want to make sense of one of the most misunderstood aspects of the stock market, turning gaps into actionable trading setups.
Check out Zeiierman Trading’s Gap Statistics indicator.
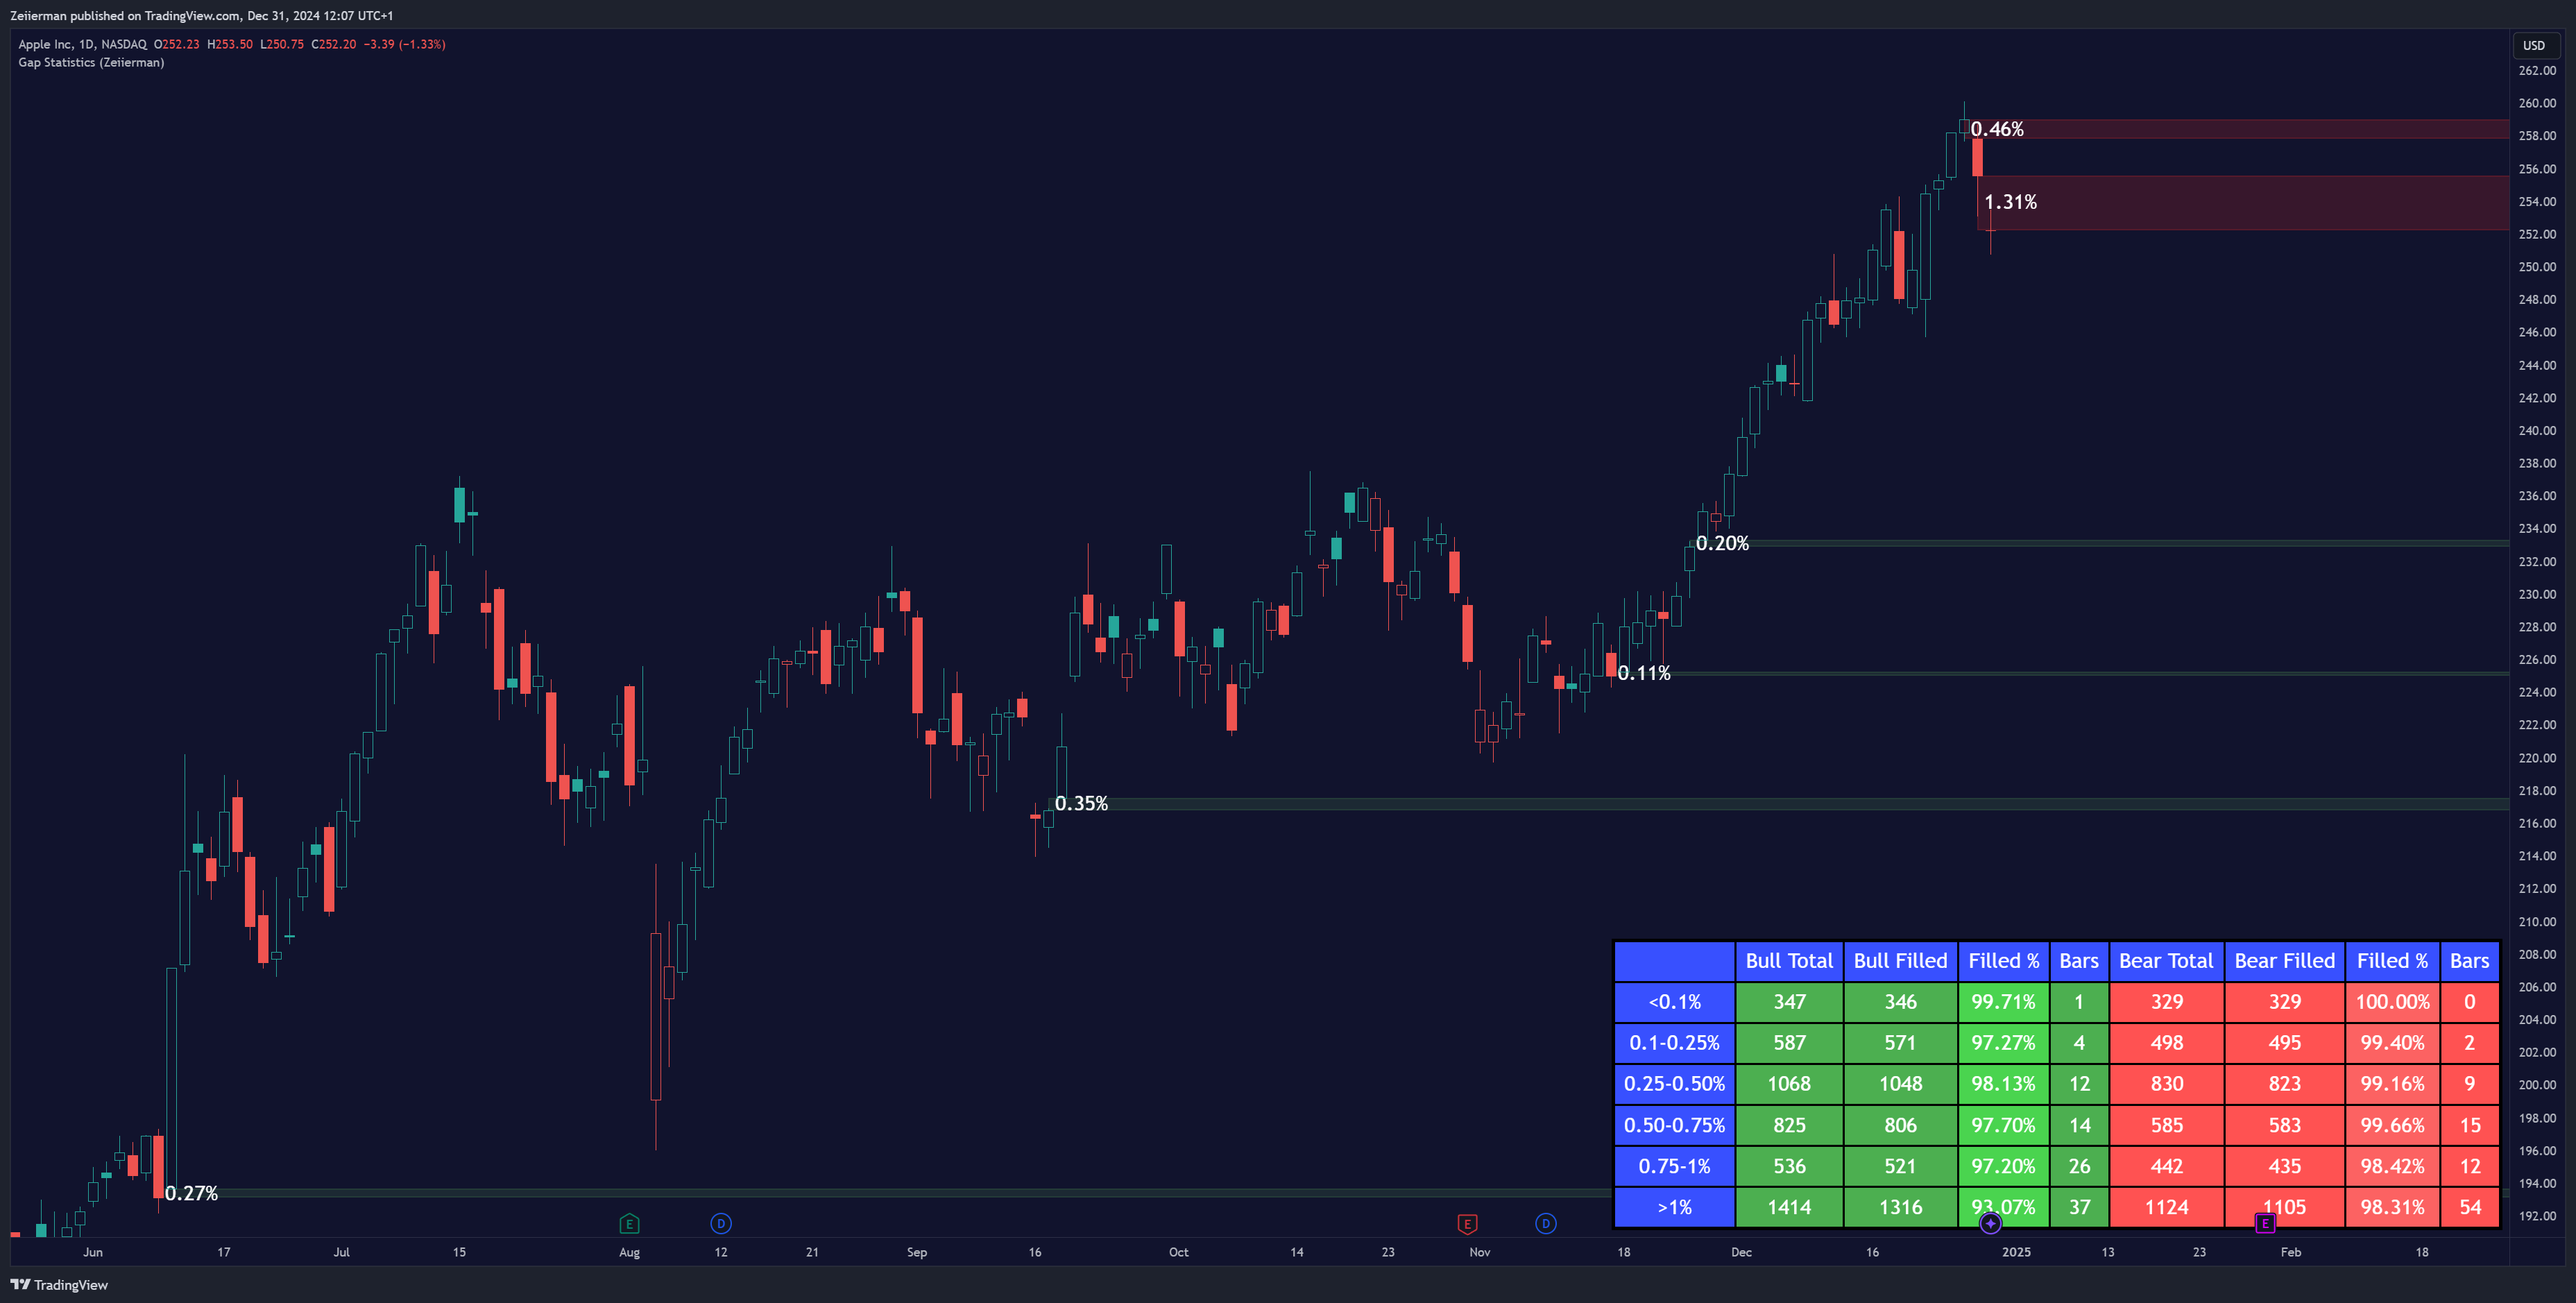
The chart highlights the Gap Statistics indicator by Zeiierman, designed to analyze and display statistical insights into market gaps. It provides detailed metrics for both bullish and bearish gaps, such as total gaps, filled gaps, and the percentage of gaps filled within various ranges (e.g., <0.1%, 0.1-0.25%, >1%).
The table in the bottom-right corner offers a clear breakdown of these statistics, showing that smaller gaps (e.g., <0.1%) are almost entirely filled (99.71% for bullish gaps, 100% for bearish gaps), while larger gaps (e.g., >1%) have slightly lower fill rates.
This indicator helps traders understand gap behavior and predict whether gaps are likely to close, offering valuable insights for planning entry and exit strategies. An excellent tool for traders focused on market inefficiencies and price action.
