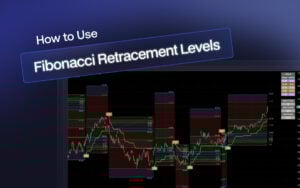
Fibonacci retracement levels are a cornerstone of technical analysis in trading.
These horizontal lines help identify potential support and resistance levels where price movements could reverse. When used correctly, they can significantly improve your trading strategy by pinpointing where to enter and exit trades.
Doesn’t that sound too good to be true? Being able to use a time-tested algorithm that can accurately tell you which decision to support.
Fibonacci retracement levels can be a game-changer in trading, but their effectiveness hinges on how well you set them up. The right settings can turn a good strategy into a great one, while the wrong settings can lead to missed opportunities and losses.
How to Use a Fibonacci Retracement Indicator?
Fibonacci retracement levels are derived from the Fibonacci sequence, a series of numbers where each number is the sum of the two preceding ones.
Here’s the sequence: 0, 1, 1, 2, 3, 5, 8, 13, 21, 34, 55, 89, 144, 233, 377, 610, 987, 1597, 2584, 4181.
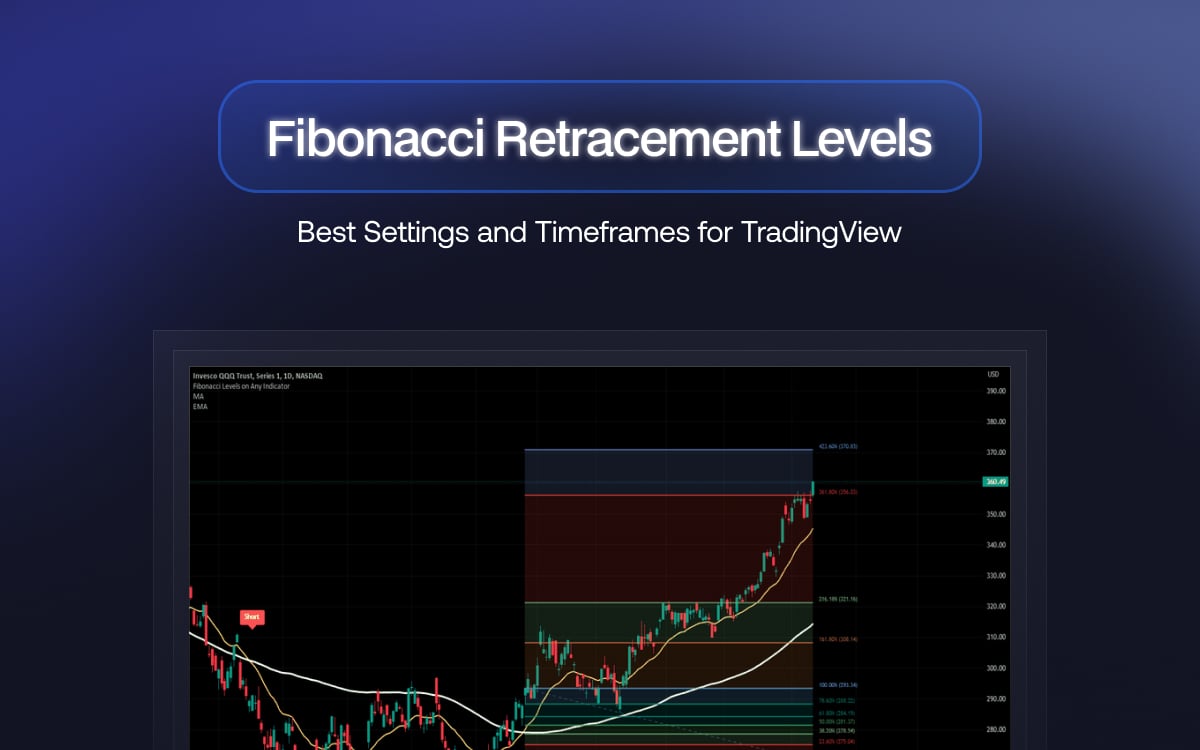
You have to select two extreme points (highest and lowest) on a price chart to draw Fibonacci retracement levels. These are the six horizontal lines on the chart called “levels.” The key levels to watch are 0.0%, 23.6%, 38.2%, 50%, 61.8%, 78.6% and 100%.
These levels indicate where the price might find support or resistance during a retracement before continuing in the original direction.
- 38.2% Level: This level often acts as the first line of defense for support or resistance. If the price retraces to this level and holds, that’s a sign the current trend may continue.
- 50% Level: While not an official Fibonacci level, I highly recommend the 50% retracement. It represents a crucial midpoint where the price might pause or reverse.
- 61.8% Level: Known as the golden ratio, this is a critical level. A bounce from here often signals a strong continuation of the trend.
In an uptrend, you might buy when the price retraces to a Fibonacci support level, such as 38.2% or 61.8%. This allows you to enter the market at a lower price before the trend resumes.
In a downtrend, look to sell when the price retraces to a Fibonacci resistance level. This helps you sell at a higher point before the price drops further.
Of course, you can skip on a lot of hassle of customizing by using Zeiierman’s FREE Auto Fibonacci Retracement indicator. You can read more on our TradingView documentation.
Best Settings & Timeframes for Using Fib Retracement Levels
I often use a combination of default and customized settings. Usually, we would start with the default levels and tweak them based on our observations of how a particular asset behaves.
For example, you might notice that AAPL often respects the 61.8% retracement but ignores the 23.6% level, leading you to adjust your indicator’s focus accordingly.
1. Day Trading
As a day trader, you’ll have to capture small price movements and make quick decisions. Tighter levels (23.6%, 38.2%, and 50%.) provide frequent signals, helping you exploit short-term price fluctuations.
To confirm signals, use shorter timeframes (5-minute or 15-minute charts) and combine Fibonacci levels with other indicators like moving averages or MACD.
Example Strategy:
On a 15-minute chart, if AAPL’s price rises from $200 to $210 and starts to pullback, look for support at the 38.2% retracement level around $206. If the price holds at this level, it could be a good entry point for a quick trade.
2. Swing Trading
Swing traders aim to capture intermediate trends, requiring more room for price fluctuations. Use broader levels (such as 38.2%, 50%, and 61.8%) to help identify significant retracement points for entering and exiting trades.
Focus on 4-hour and daily charts. Look for confluences where Fibonacci levels align with other support and resistance zones or trend lines to enhance the reliability of your signals.
On a daily chart, if Bitcoin’s price climbs from $30,000 to $40,000 and then begins to retrace, watch for support at the 50% level around $35,000. A bounce at this level could indicate a good opportunity to enter a swing trade.
3. Long-Term Investing
Focus on major price movements and trend reversals through key levels like 50% and 61.8%. Use weekly or monthly charts for timeframes.
Look for long-term trends and ensure the fundamental analysis supports the technical signals of Fibonacci retracement levels.
Penny For Your Thoughts: Adjusting Fibonacci settings is an iterative process. It’s best to start with default levels and gradually refine them as you gain more experience with a particular asset.
Combining Fib Retracement with Other Indicators
Using Fibonacci retracement levels alone can provide good information, but it is not yet actionable. For that, you have to pair it with other indicators to compound the accuracy.
1. Moving Averages
Find areas where Fibonacci retracement levels overlap with significant moving averages (e.g., 50-day or 200-day MA). These confluence zones often act as stronger support or resistance levels.
Use moving averages to confirm the overall trend direction. If the price is above the moving average, the trend is generally up; if below, the trend is down.
When the price retraces to a Fibonacci level and coincides with a moving average, it can be an optimal entry or exit point.
For example, if the price retraces to the 38.2% Fibonacci level in an uptrend and meets the 50-day moving average, it might be a strong buy signal.
2. RSI and MACD
Use RSI to gauge overbought or oversold conditions at Fibonacci levels. If the price retraces to a key Fibonacci level (e.g., 61.8%) and the RSI indicates an oversold condition (RSI < 30), it strengthens the likelihood of a price reversal.
Look for MACD crossovers at Fibonacci levels. A bullish crossover (MACD line crossing above the signal line) near a Fibonacci support level can confirm a buy signal. In contrast, a bearish crossover near a resistance level can confirm a sell signal.
Example: Suppose Ethereum retraces to the 50% Fibonacci level, and the RSI is below 30, indicating an oversold condition. Additionally, if the MACD shows a bullish crossover, these combined signals suggest a strong buying opportunity.
3. Support and Resistance Levels
Combine Fibonacci levels with horizontal support and resistance zones identified through price history. If a Fibonacci level aligns with a historical support or resistance level, it becomes a more significant zone.
Use pivot points in conjunction with Fibonacci retracement.
High volume at Fibonacci retracement levels can indicate stronger support or resistance. Look for volume spikes at these levels to confirm the significance of the retracement point.
Example: If a stock retraces to the 61.8% Fibonacci level, which also coincides with a well-established horizontal support level from previous price action, and there’s a spike in trading volume, this confluence can provide a strong buy signal.
Zeiierman
With over 16 years in the market, Zeiierman has extensive experience as a full-time trader and risk advisory consultant for hedge funds. He has developed many profitable trading strategies, drawing on his background in risk management and strategy execution.
More from Zeiierman