When choosing the best indicators for the crypto market, it is vital to select tools to handle its unique characteristics, such as high volatility, inefficiency, and varying liquidity levels among different coins.
The tools I have selected for you today are the ones I use for my trading strategies. The crypto collection ranges from dynamic trend indicators that adjust in real time to sophisticated ML-based (machine learning) indicators that learn from price movements to improve their predictive accuracy.
Note: If you’re interested in how any of these indicators work, I have included links to the TradingView site under each indicator with the proper documentation.
1. Dynamic Trend Indicators
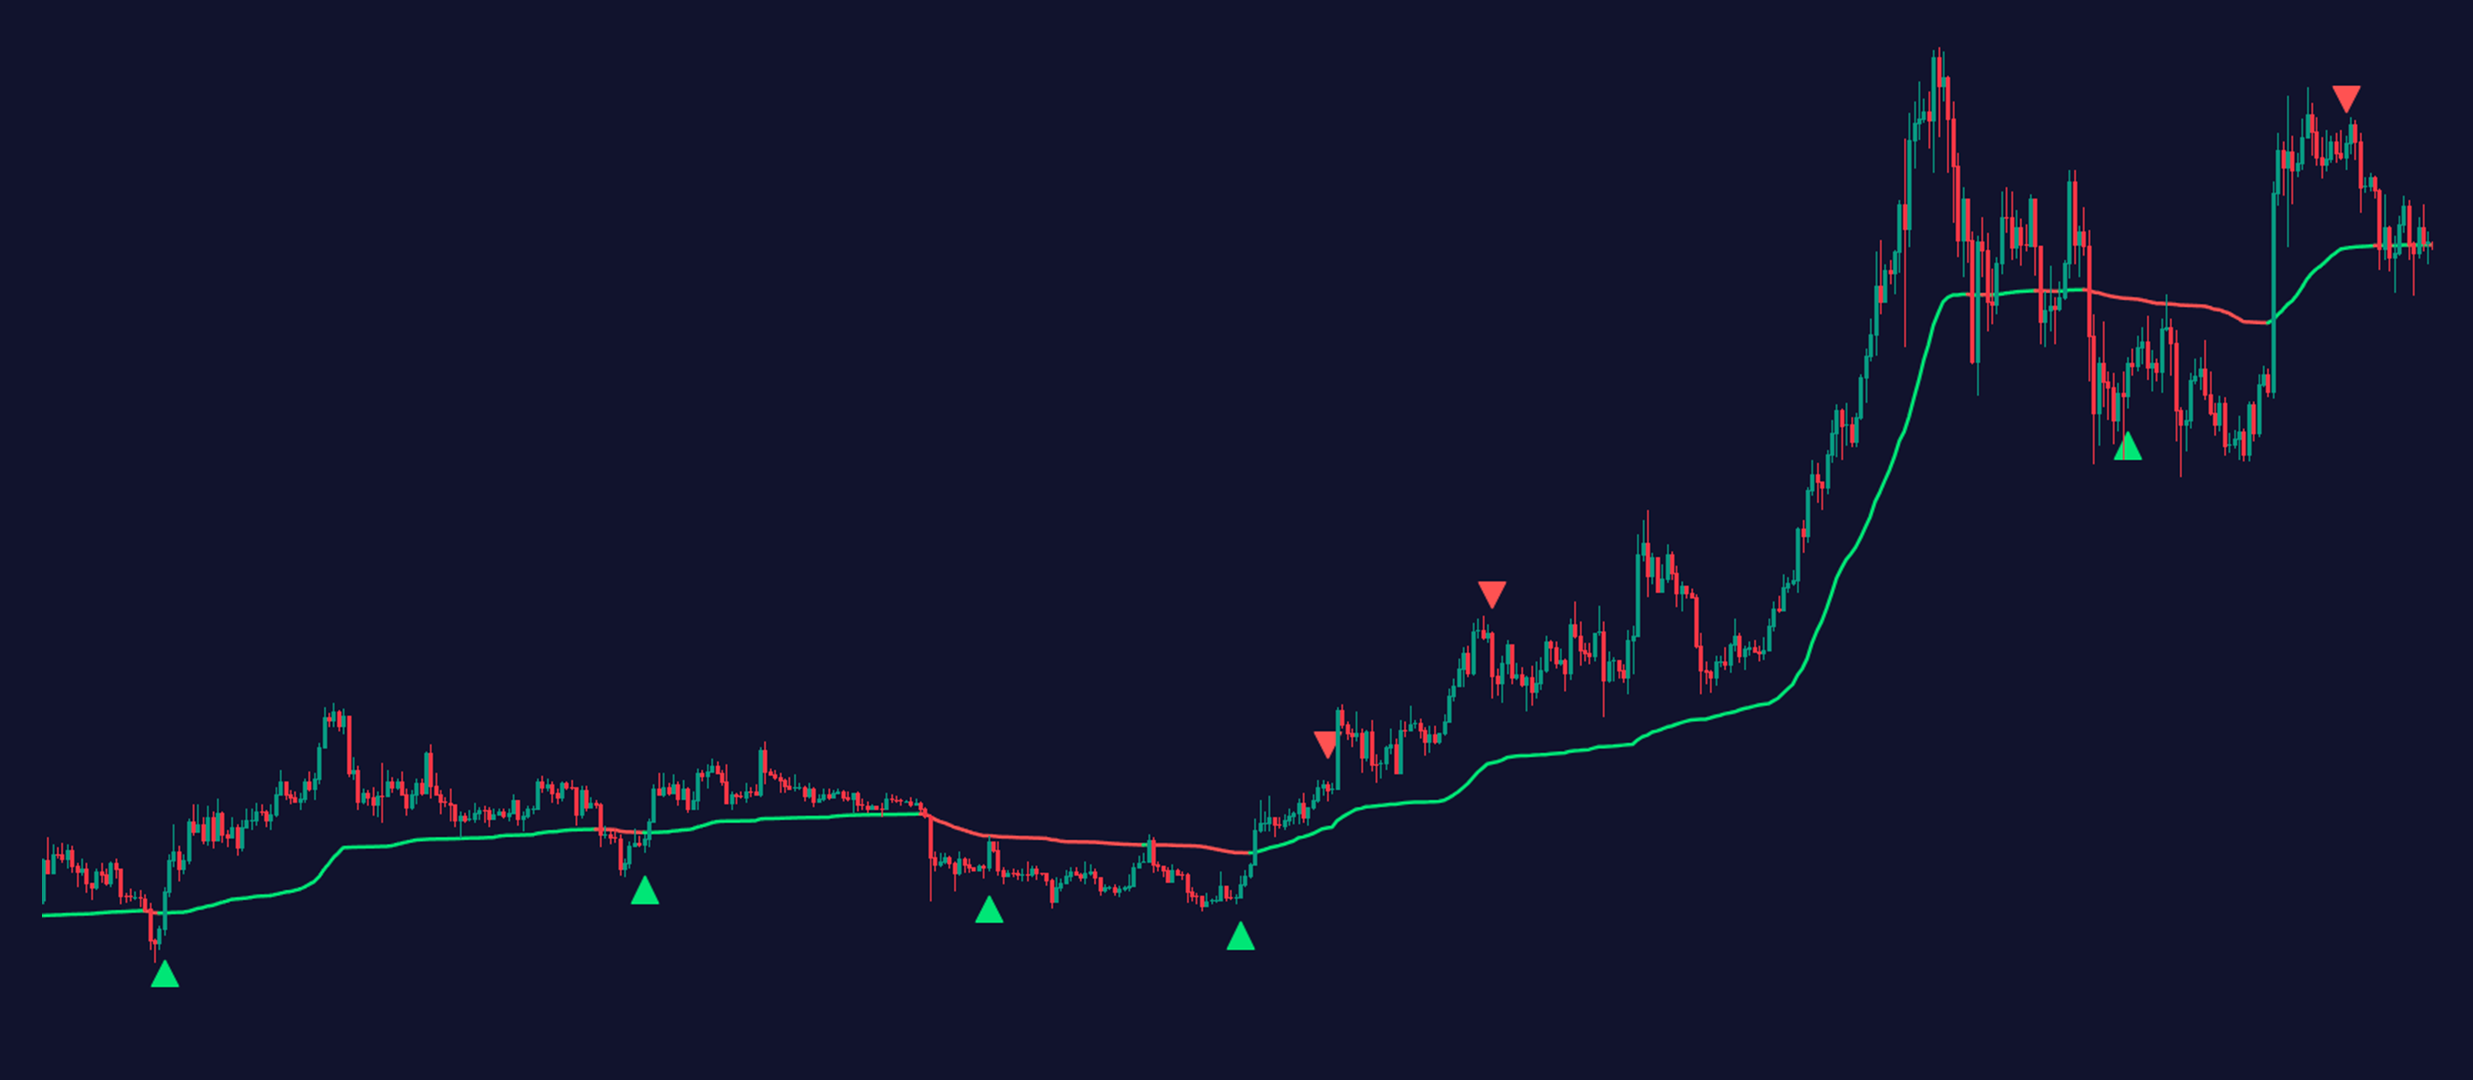
Dynamic Trailing Indicator
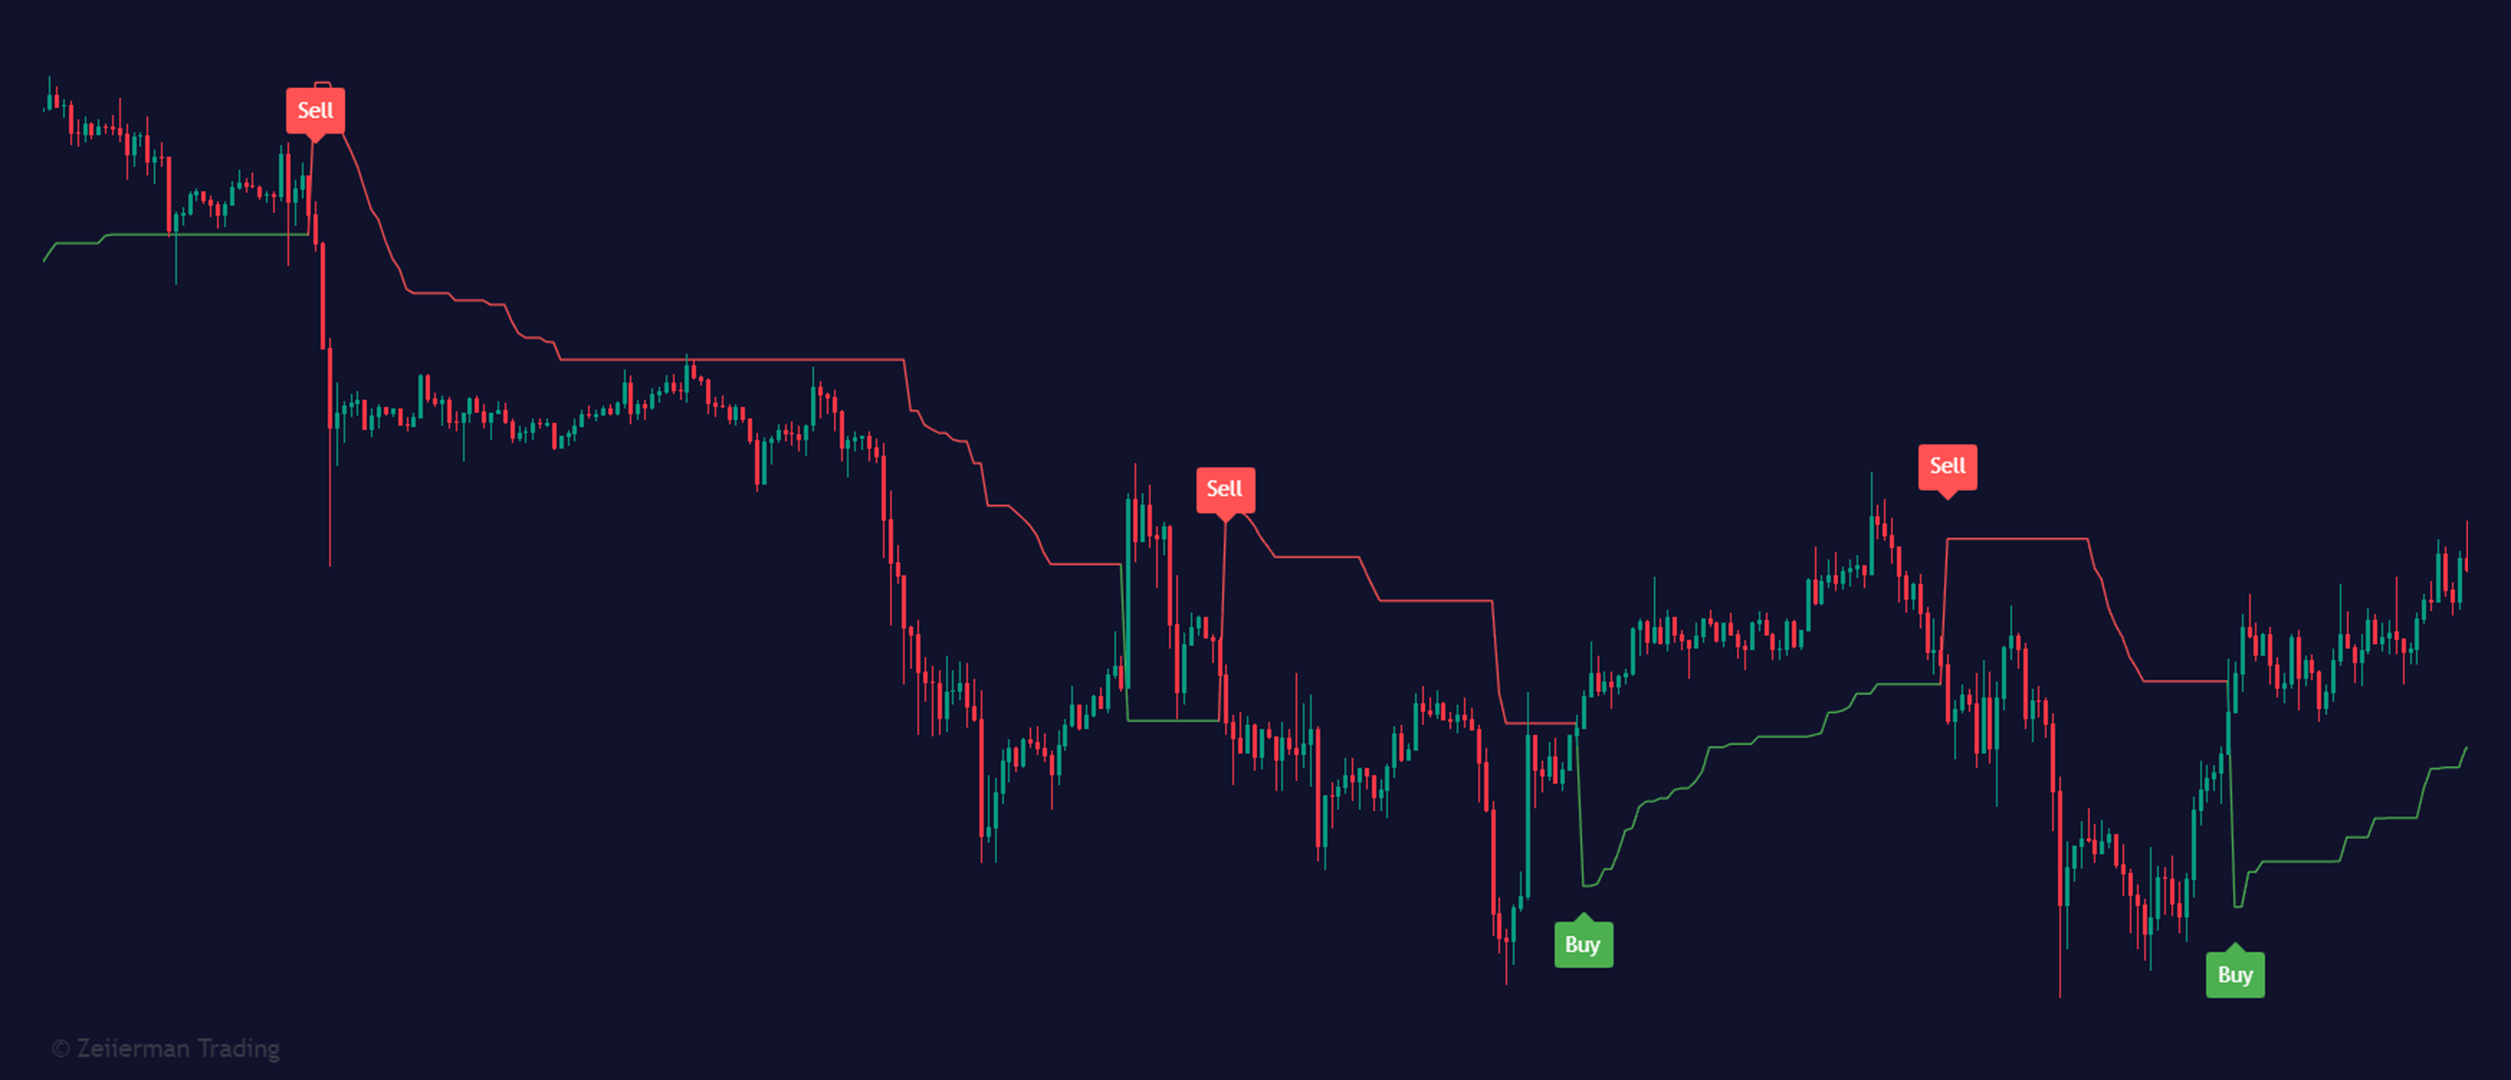
This indicator enhances the traditional SuperTrend approach and is designed to adjust stop-loss levels automatically as price movements evolve throughout the day.
Dynamic Trailing tool is particularly useful in the highly volatile crypto market, where traditional stop-loss strategies may leave too much profit on the table or exit positions too early.
How to Use: The primary function is to help you quickly identify the prevailing market trend. A change in the color of the dynamic trailing line or its position relative to the price can signal potential trend reversals.
Start using the Dynamic Trailing indicator on TradingView!
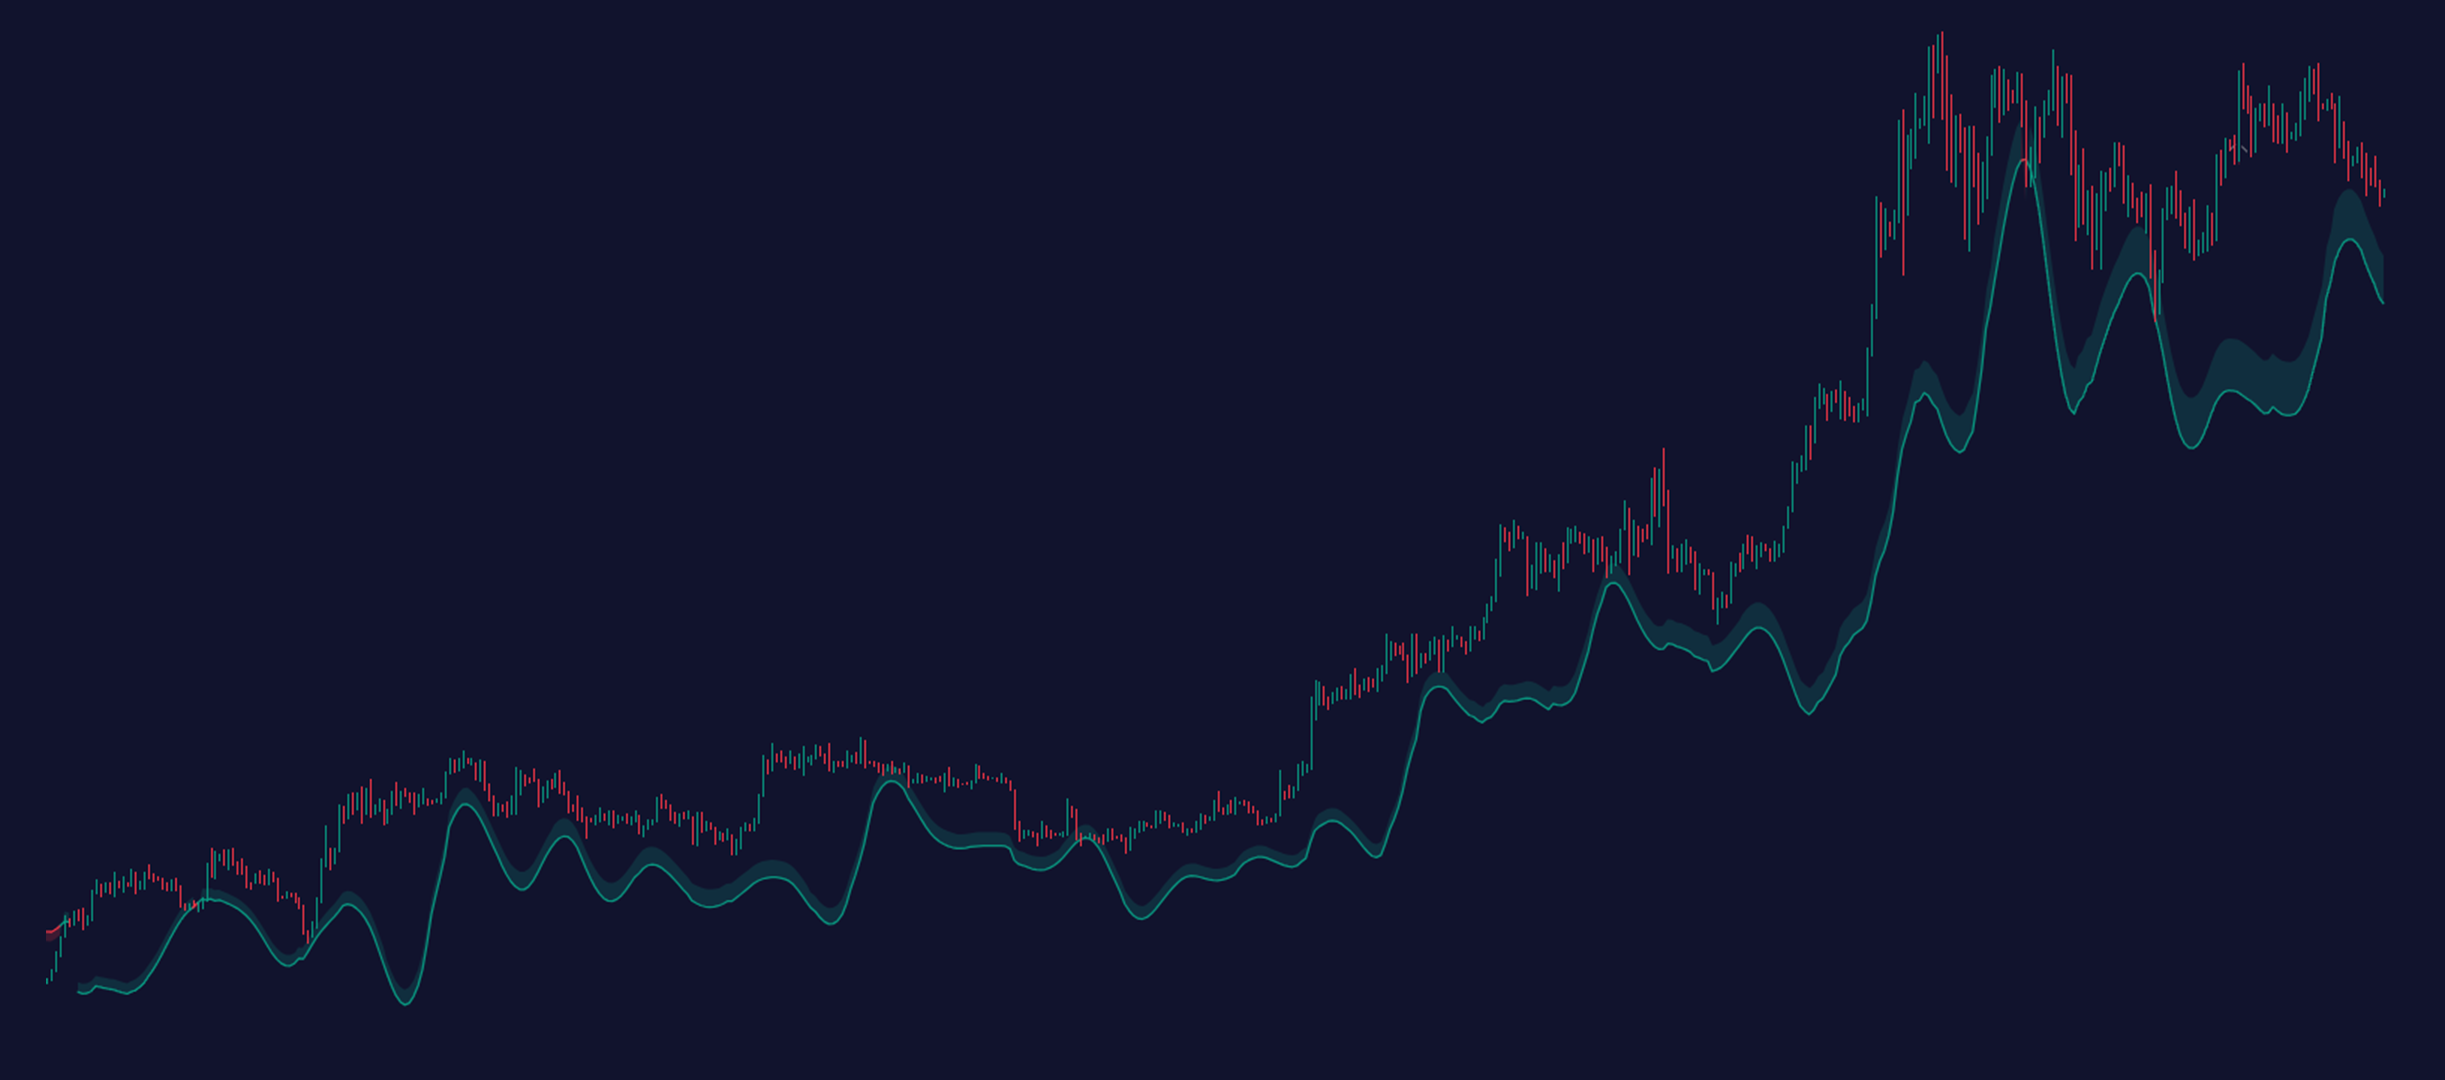
Volatility Trend Indicator
This indicator is great for assessing the strength and sustainability of a trend based on market volatility.
Unlike typical trend indicators that may only reflect price movements, the Volatility Trend incorporates volatility into its analysis, offering a more robust view of the market’s direction.
This feature is particularly valuable for crypto traders who must differentiate between false signals and genuine market trends almost all the time.
Hot to Use: Use the trend line to identify the overall market direction. An upward-sloping line indicates an uptrend, while a downward-sloping line indicates a downtrend.
Start using the Volatility Trend indicator on TradingView!
2. Volatility Indicators
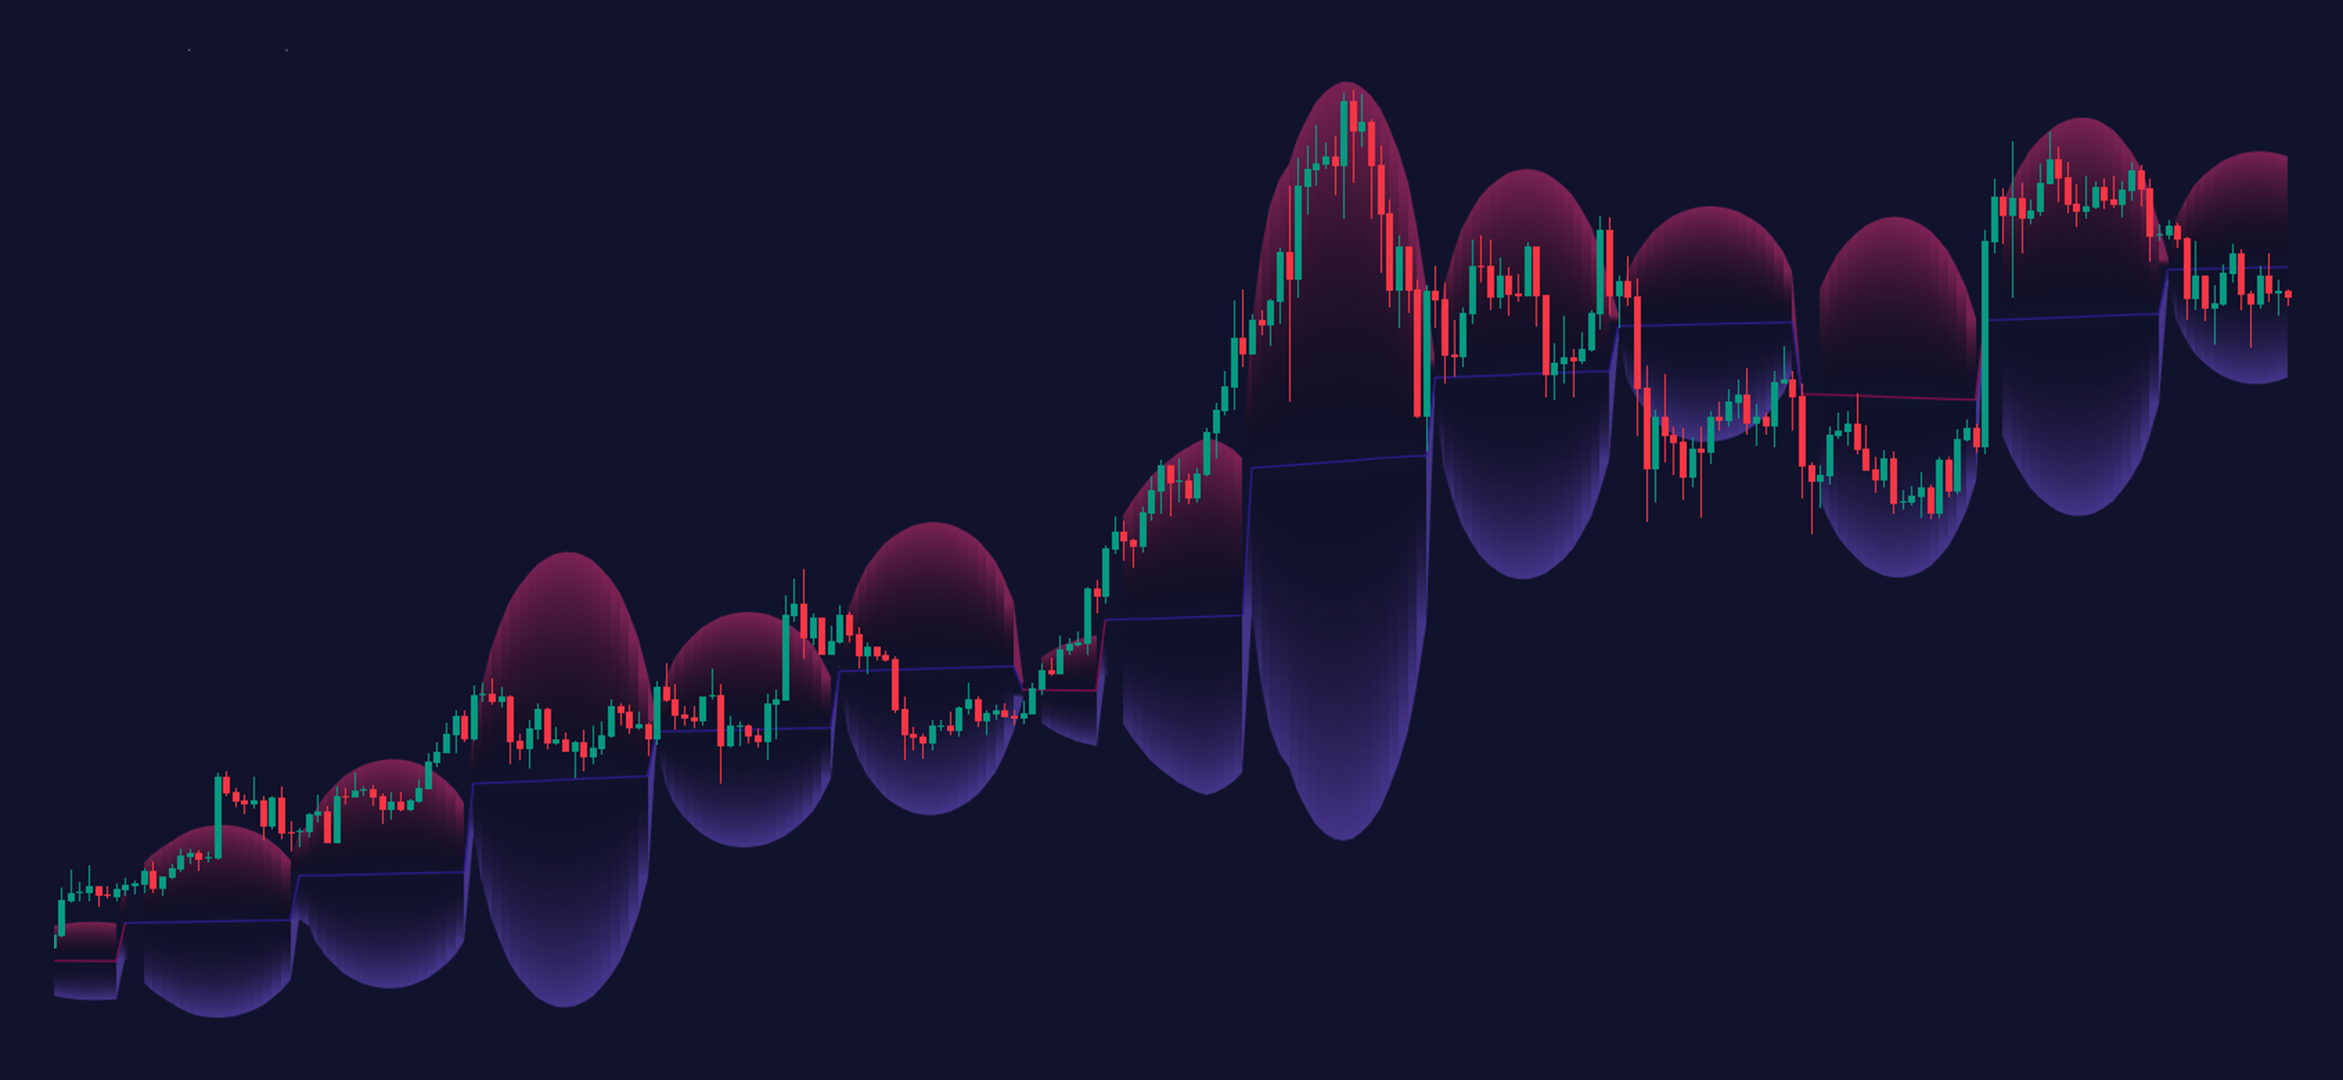
Grid by Volatility
This is a dynamic indicator that overlays a grid on the price chart, reflecting changes in volatility. This grid adjusts in real-time, expanding when volatility increases and contracting when it decreases.
Grid by Volatility provides a visual representation of market sentiment and the intensity of price movements.
How to Use: The grid helps you visually assess the volatility levels at a glance, which can be crucial for setting appropriate trade entries and exits.
For example, a widening grid suggests increasing volatility. Conversely, a narrowing grid indicates decreasing volatility, suggesting a calmer market environment or a potential buildup to a significant price move.
Start using the Grid by Volatility (Zeiierman) on TradingView!
Average True Range (ATR)
The Average True Range (ATR) is measures the degree of price volatility by analysing the price range of an asset with the given time period.
Higher ATR values indicate higher volatility and vice versa. This indicator does not provide directional information, which means it needs to be combined with other indicators for best results.
ATR + PSAR Trailing Stop (Expo) – Our indicator uses ATR as an input for trend direction. So this indicator does actually show the direction of the market.
How to Use: ATR can be especially useful in the crypto market to manage risk. For instance, a trader might set a stop-loss at a multiple of the ATR away from the current price.
If the ATR is high, it indicates high volatility, suggesting a wider stop-loss to avoid being prematurely stopped out by normal market fluctuations. On the other hand, a low ATR indicates a less volatile market, where stops can be tighter, protecting profits while minimizing potential downside risk.
Start using the ATR + PSAR Trailing Stop (Zeiierman) on TradingView!
3. Volume Indicators
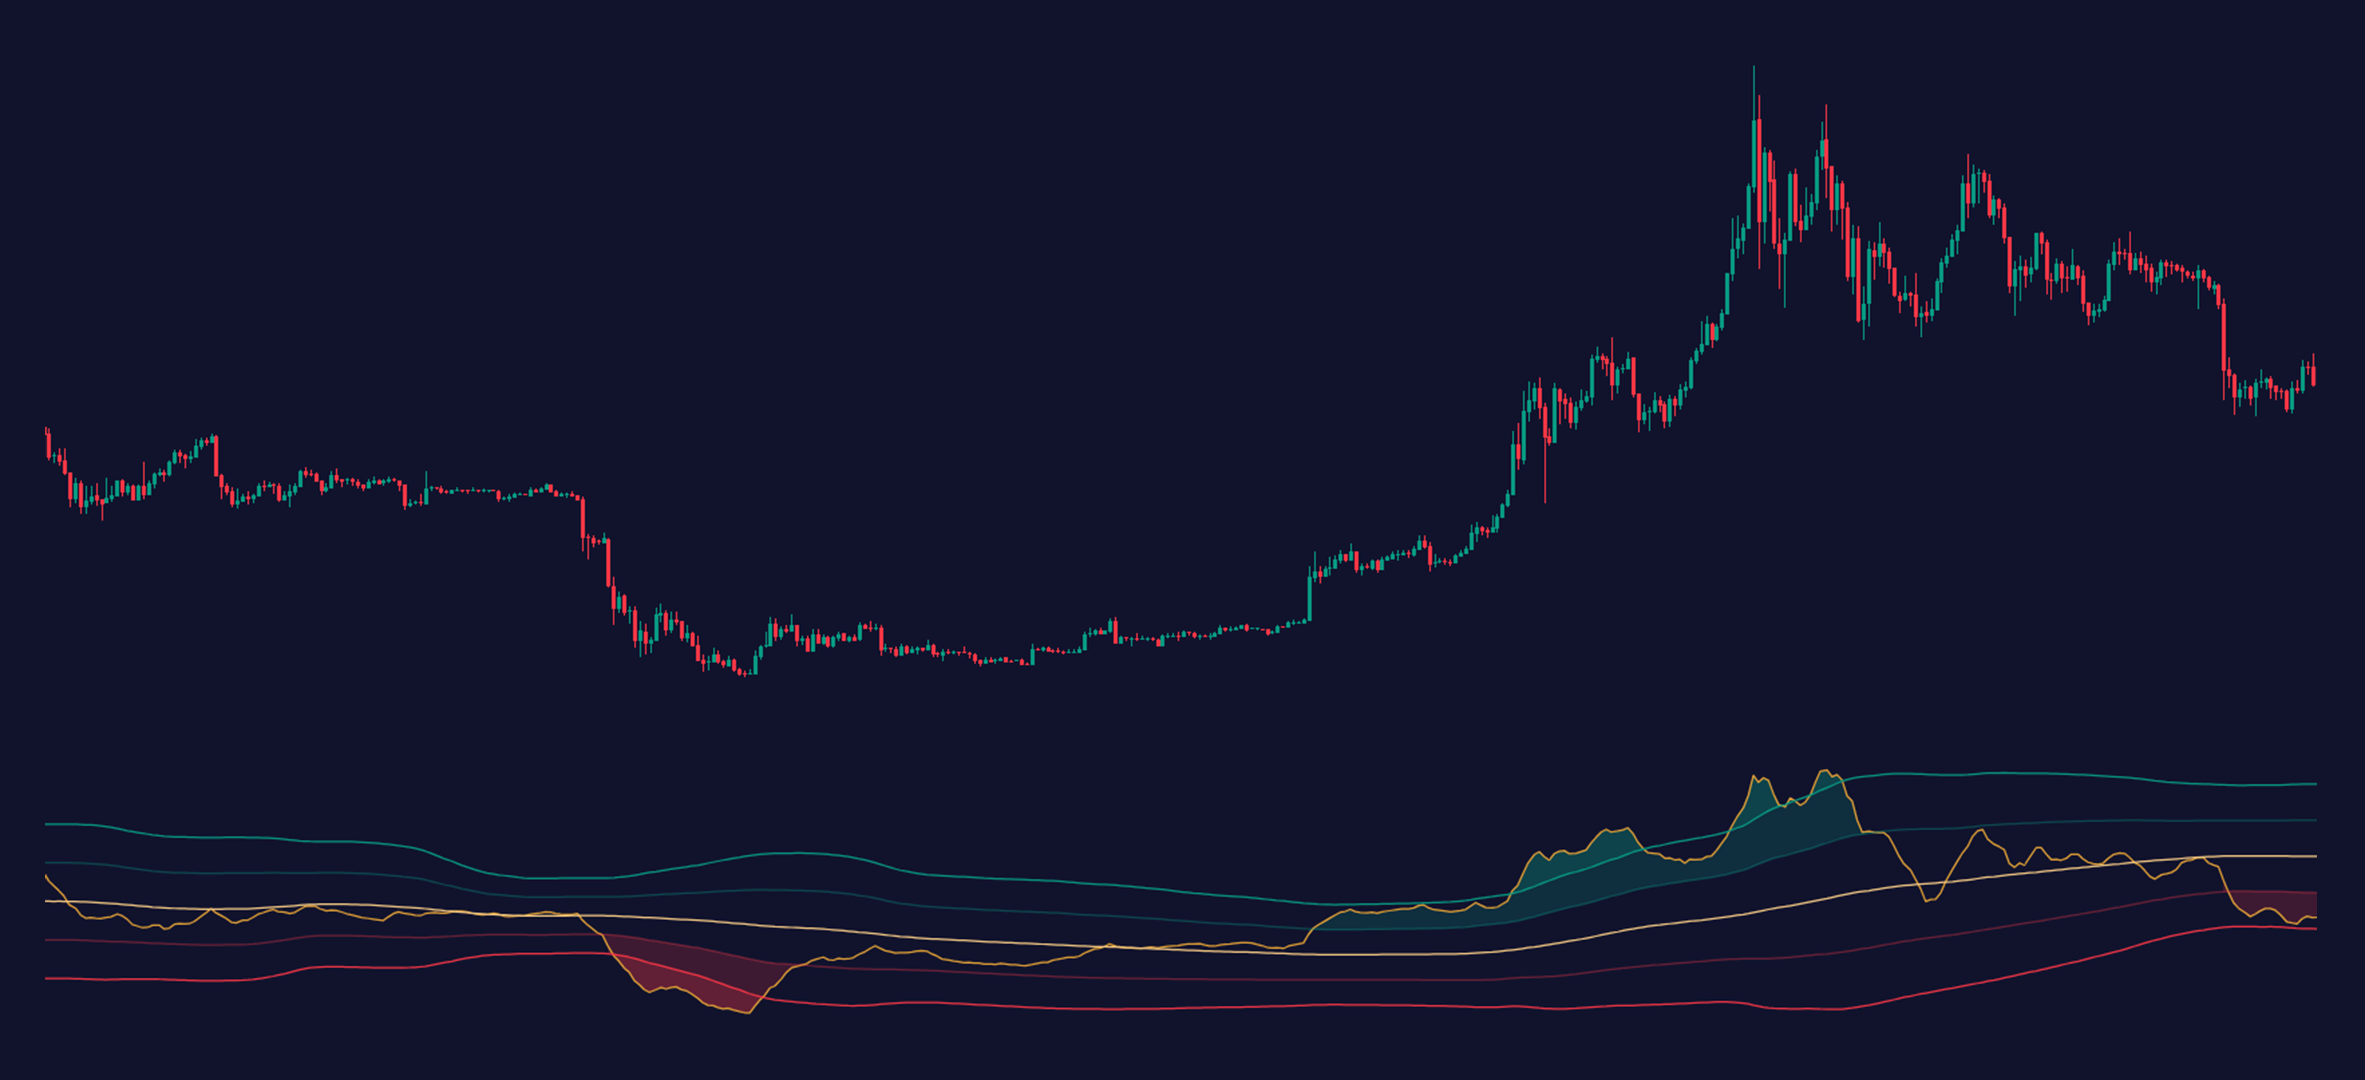
Liquidation Volume Zeiierman
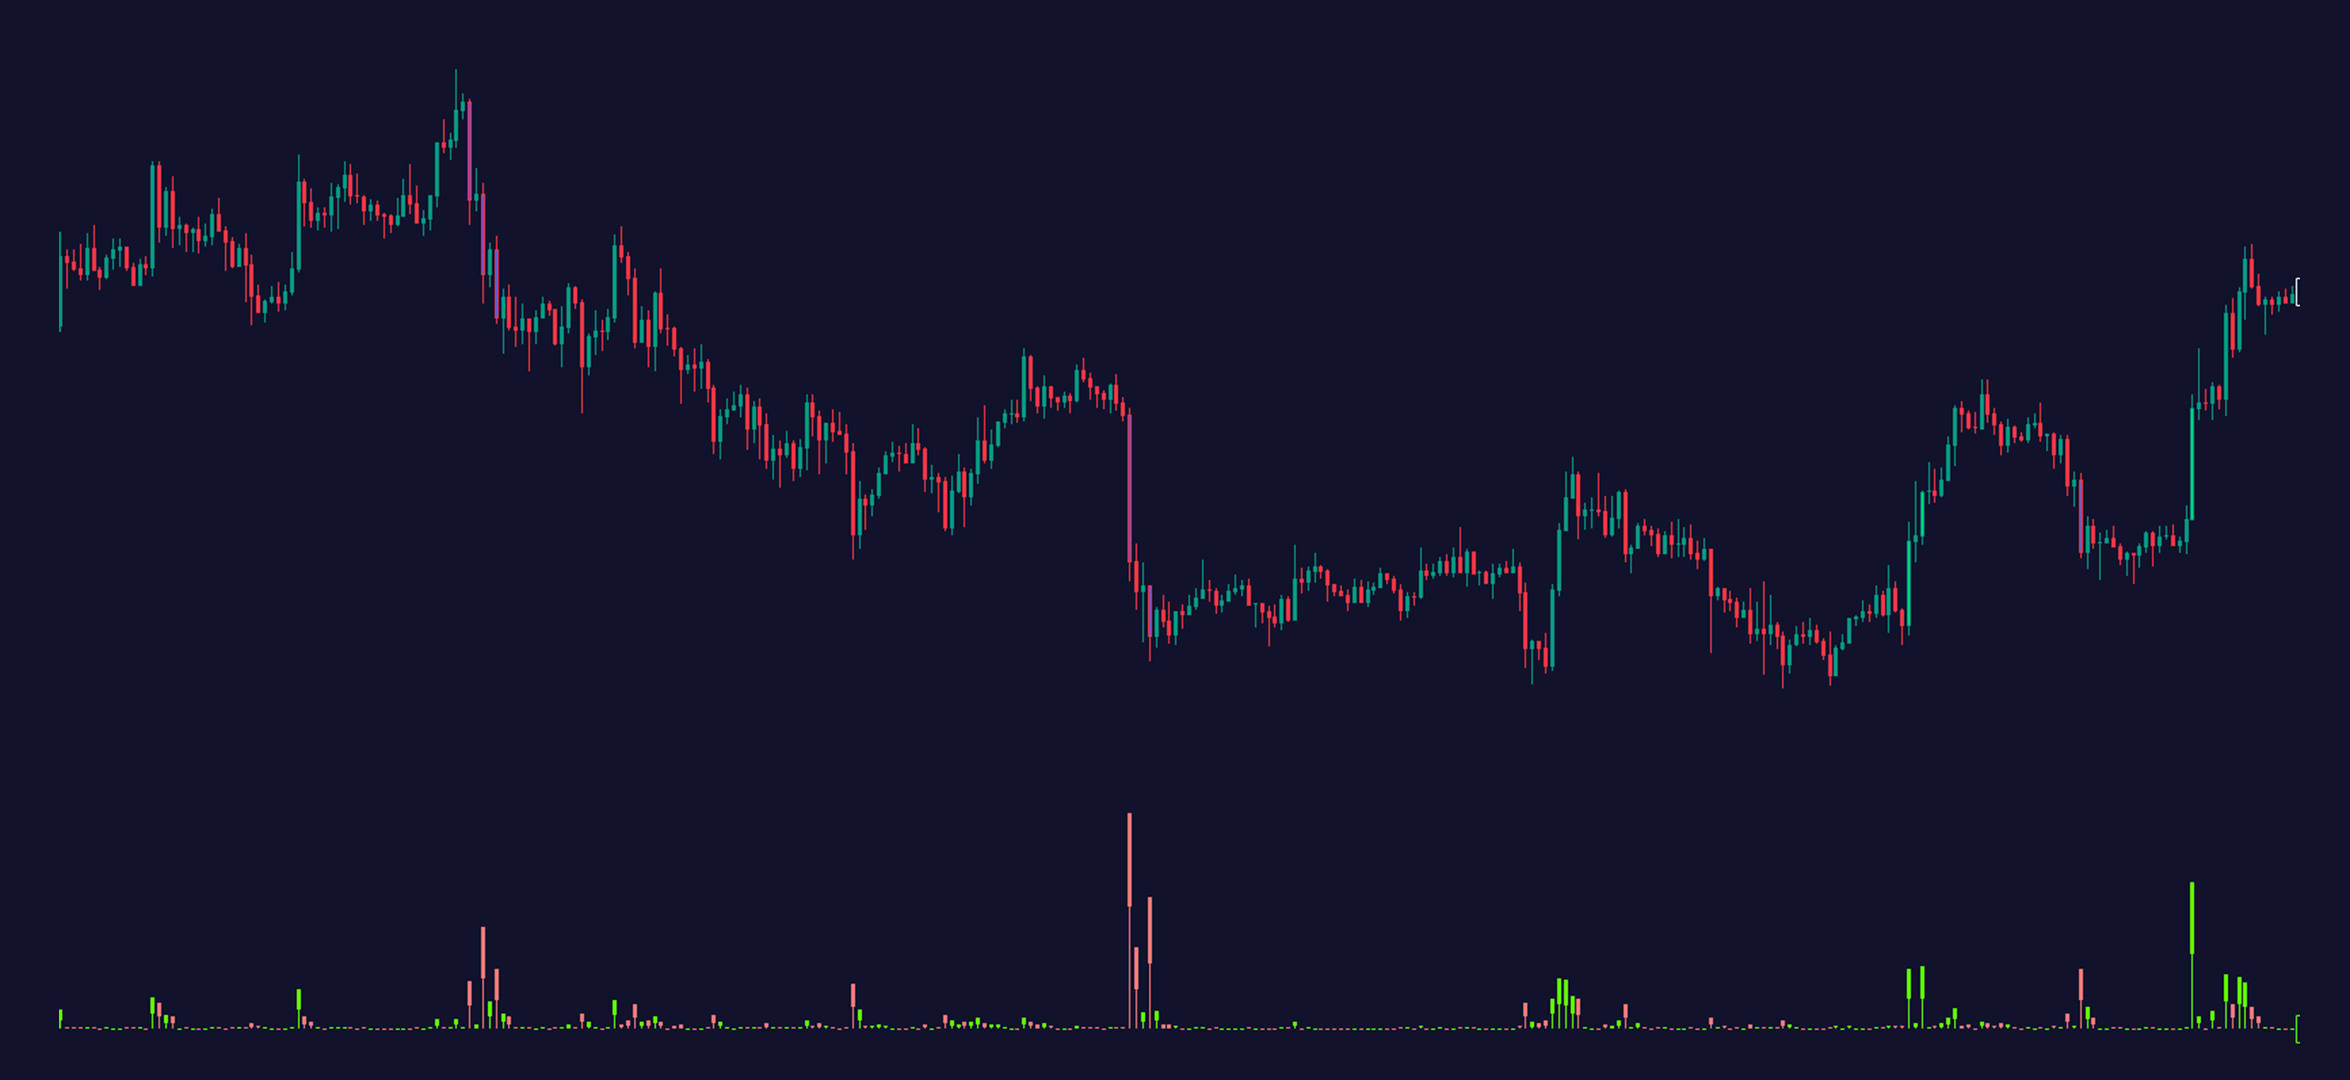
This indicator is tailored to highlight significant volume liquidation points, which may signal key reversal zones in the market.
The Liquidation Volume is particularly useful for identifying areas where substantial selling or buying pressure has culminated, potentially leading to a pivot in market direction.
How to Use: This indicator plots points or bars where major liquidations occur, allowing us to spot potential tops and bottoms based on volume spikes.
For example, a sudden spike in volume at new price lows might suggest a selling climax (prices may start rising soon). Conversely, a spike at price highs could indicate a buying climax, possibly foretelling a forthcoming downturn.
Start using the Liquidation Volume indicator on TradingView!
On-Balance Volume (OBV)
The on-balance volume (OBV) is a classic indicator that uses volume flow to predict changes in stock price. In cryptocurrency trading, OBV can be pretty useful marker of market momentum.
How to Use: OBV is straightforward: it adds volume on “up” days and subtracts volume on “down” days. An ascending OBV suggests that buyers are willing to increase prices, while a declining OBV indicates increasing selling pressure.
Start using the On-Balance Volume (OBV) indicator on TradingView!
4. Dynamic Momentum Indicators
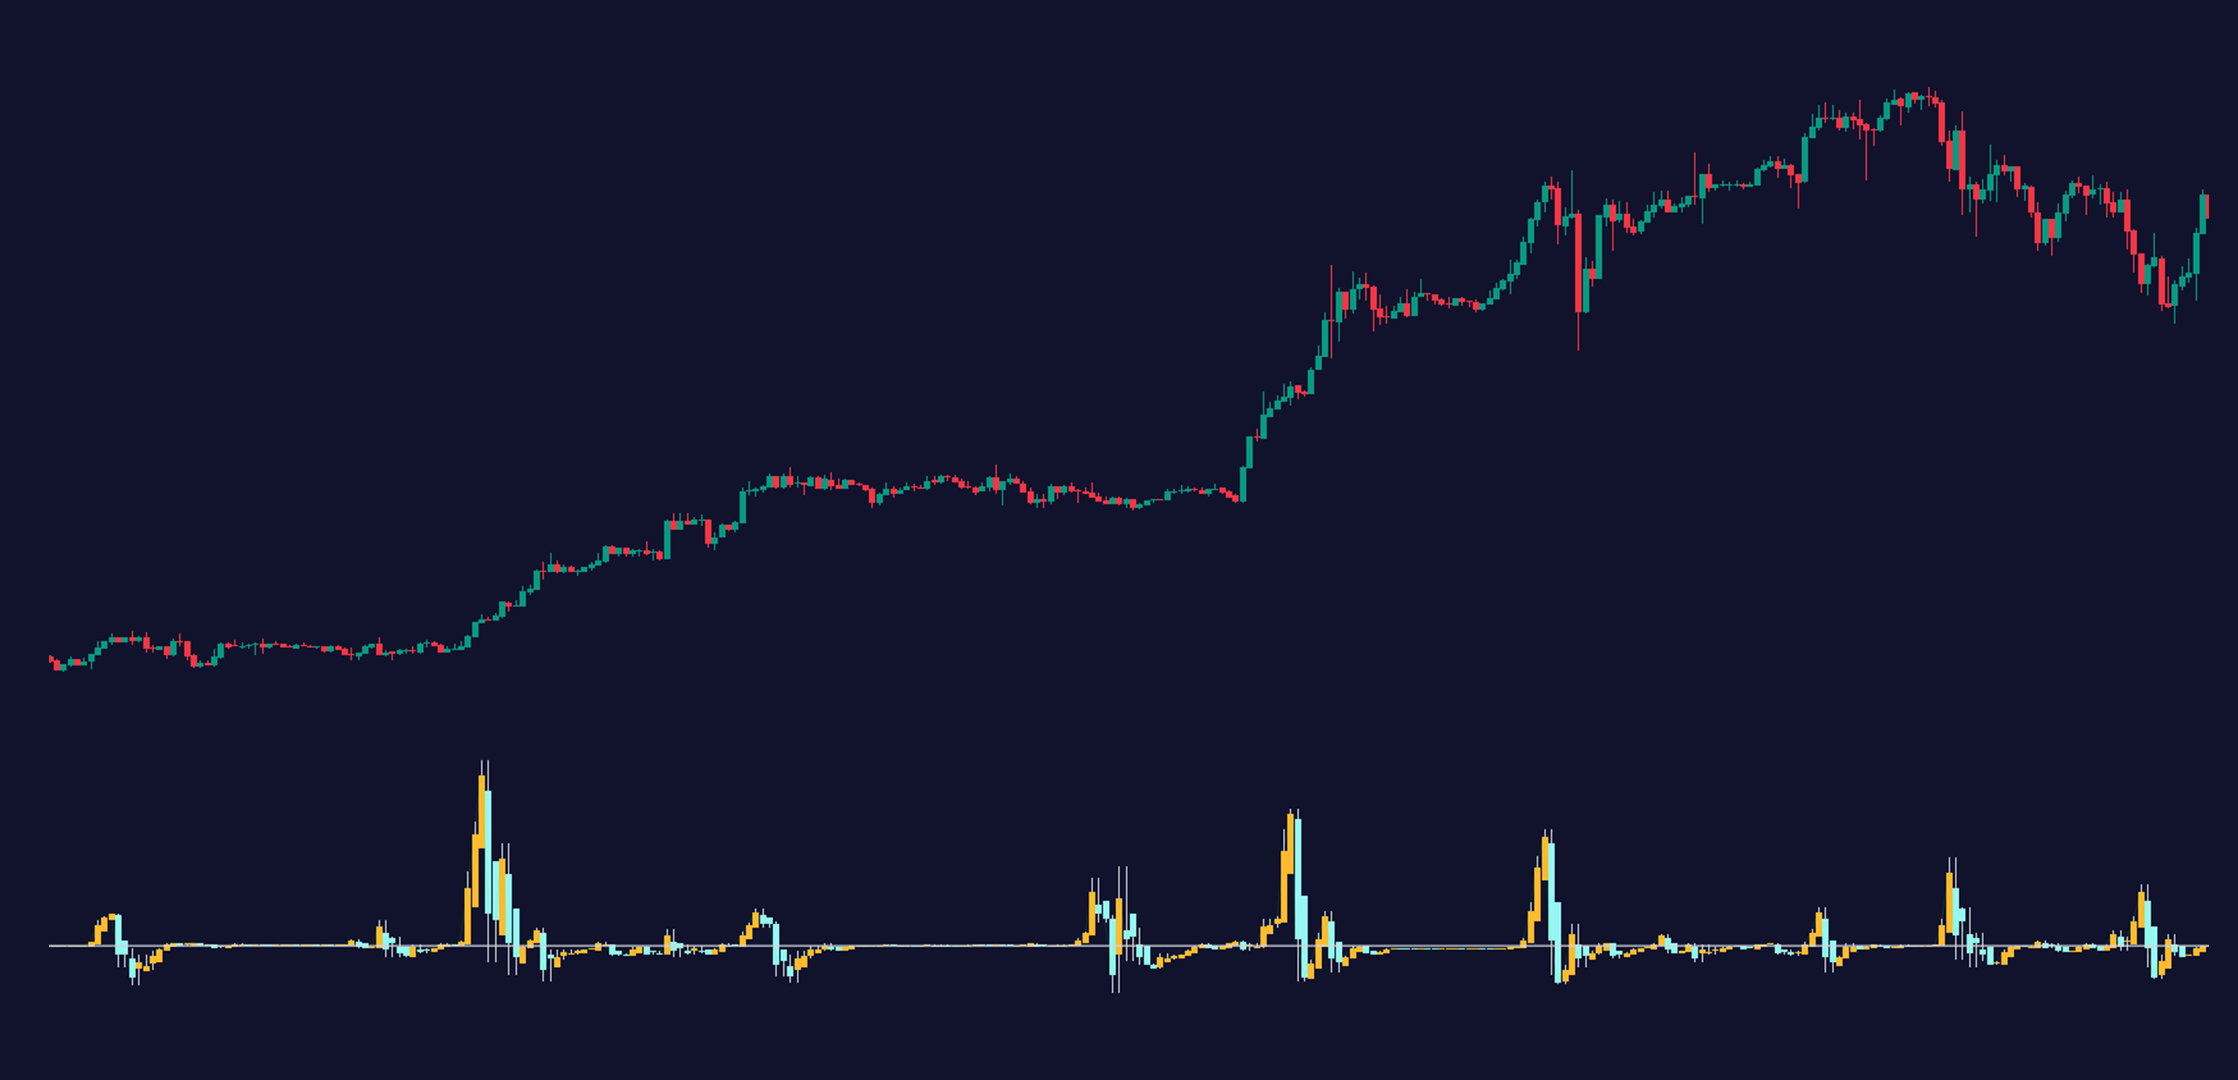
Dynamic Price Oscillator
The Dynamic Price Oscillator is an enhanced version of traditional oscillators supercharged with volatility adjustments and Bollinger Bands (BB).
It offers insights into the momentum behind price movements. Unlike standard oscillators that might only signal overbought or oversold conditions, DPO adjusts dynamically to changing market conditions, giving a more nuanced view of market momentum.
How to Use: It calculates the velocity of price changes and visually represents this momentum as a line oscillator on the chart. You should look for significant divergences between the oscillator and the price itself to fully utilize this indicator.
Start using Dynamic Price Oscillator (DPO) on TradingView!
RSI with Self-Adjusting Bands
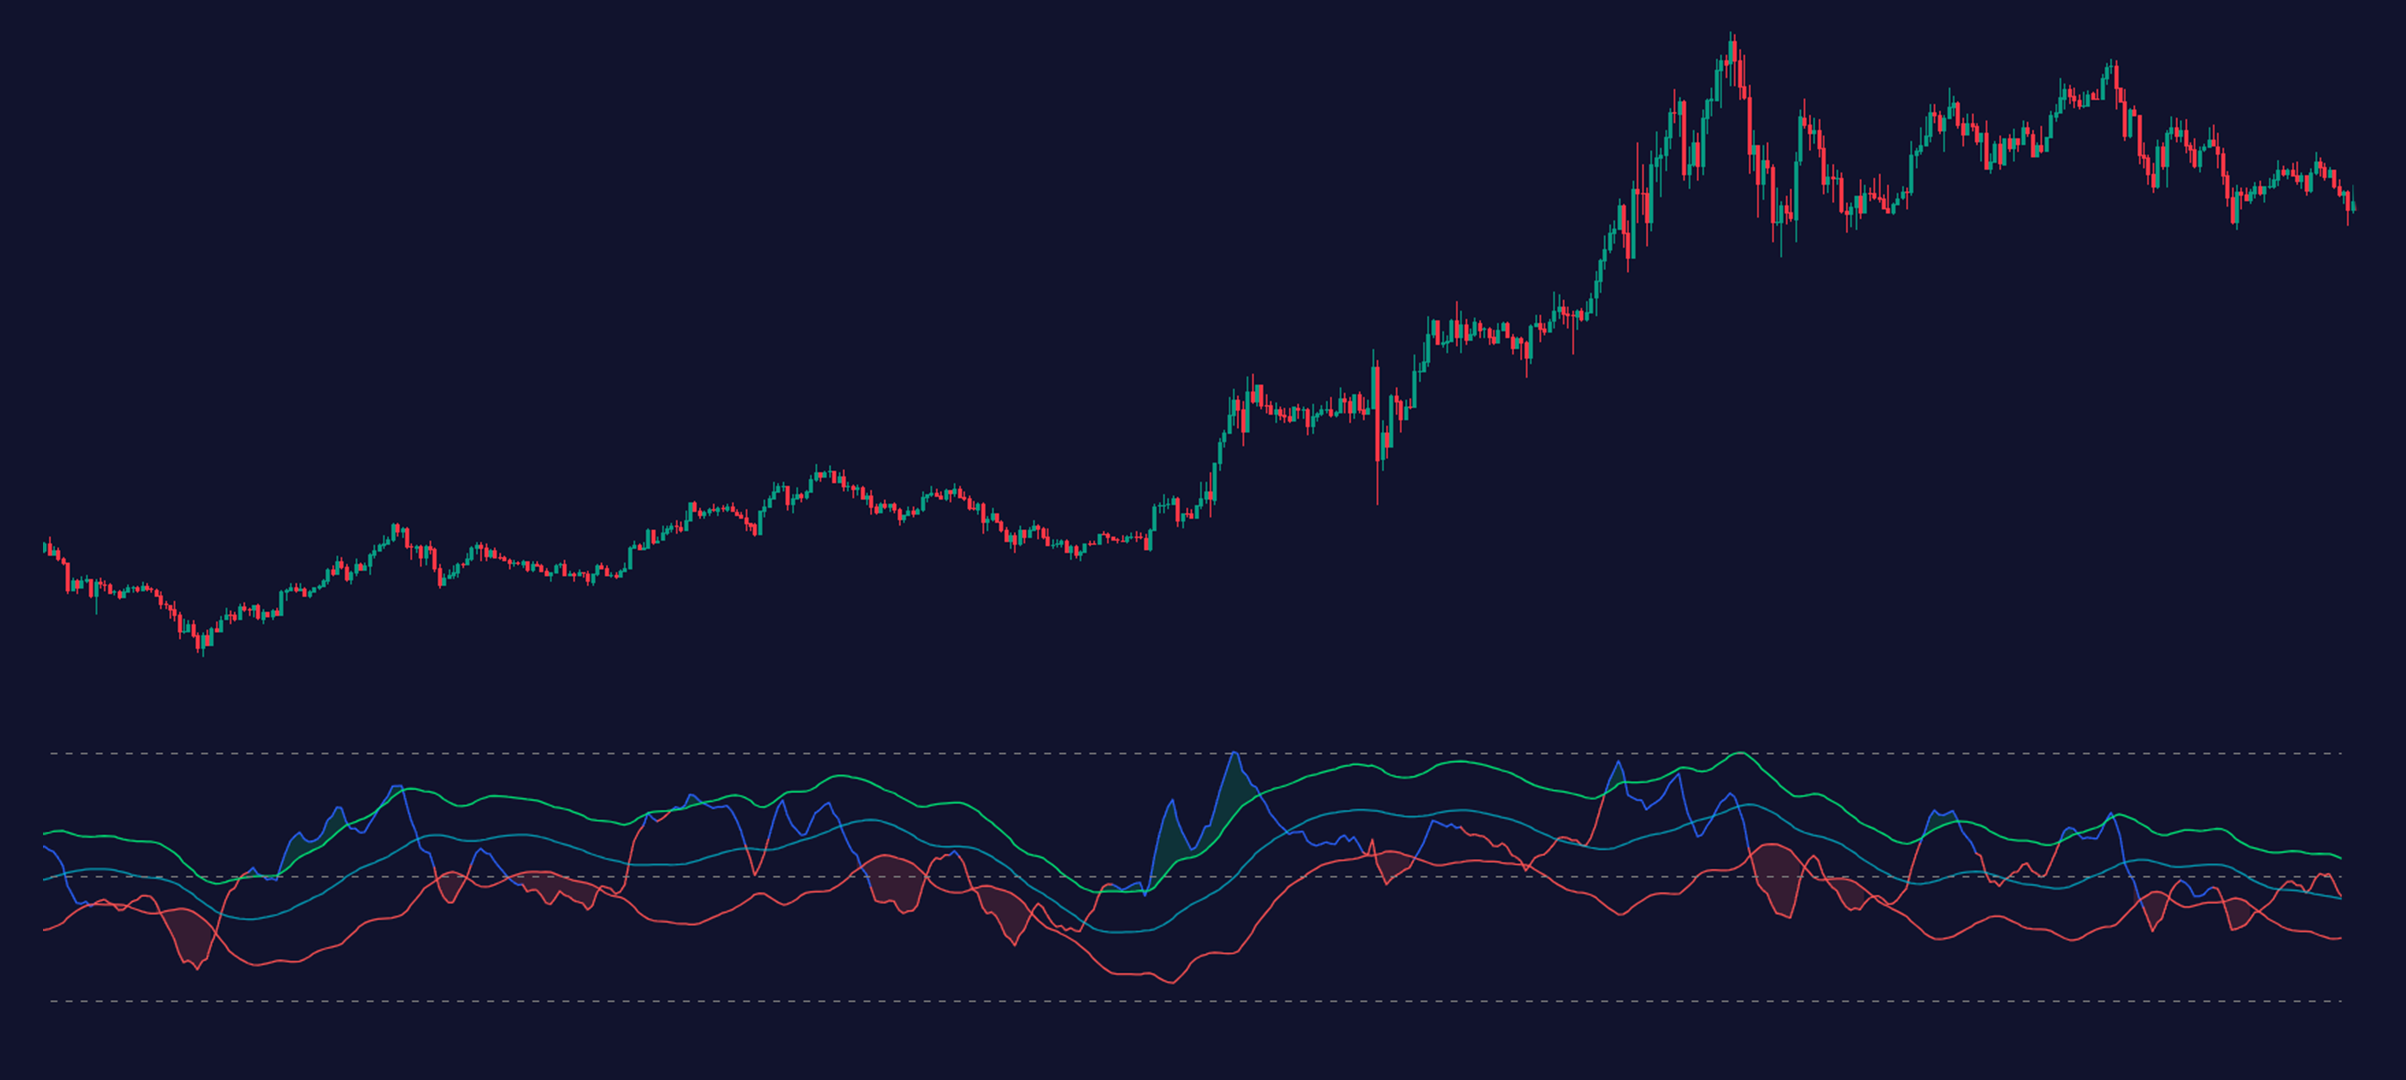
This indicator enhances the classic Relative Strength Index (a staple in every beginner’s and pro’s toolkit) with bands that adjust based on recent volatility. This modification helps to filter out the noise and provides clearer signals about overbought and oversold conditions.
How to Use: You can use this tool to better understand when the market is reaching extremes. For example, when the RSI crosses above the upper band, it suggests an overbought condition. Conversely, RSI below the lower band paints the picture of an oversold market.
Start using RSI with Self-Adjusting Bands on TradingView!
5. Proper Risk Management Indicators
Trade & Risk Management Tool
Effective risk management isn’t just advisable; it’s essential in the unpredictable terrain of cryptocurrency trading. This tool is specifically designed to aid traders in safeguarding their capital while optimizing their profit potential.
How to Use: It helps you define risk levels for each trade by calculating and visualizing potential loss and gain scenarios directly on the trading chart. It also lets you adjust stop-loss and take-profit levels according to your risk tolerance and the specific market conditions.
Start using Trade & Risk Management Tool on TradingView!
6. Machine Learning-Based Moving Average Indicators
Machine Learning Momentum Index (MLMI)
This indicator uses machine learning techniques to analyze historical data and identify patterns that might not be obvious or detectable with traditional methods. MLMI adapts to the market, potentially providing more reliable signals in the fast-moving crypto market.
How to Use: By continuously learning from new data, MLMI adjusts its signals to reflect the latest market conditions. You can use this tool to anticipate trend reversals and momentum shifts, helping to optimize entry and exit points.
Start using Machine Learning Momentum Index (MLMI) on TradingView!
7. FVG Dynamics
Institutional FVG & Liquidity Range Candle
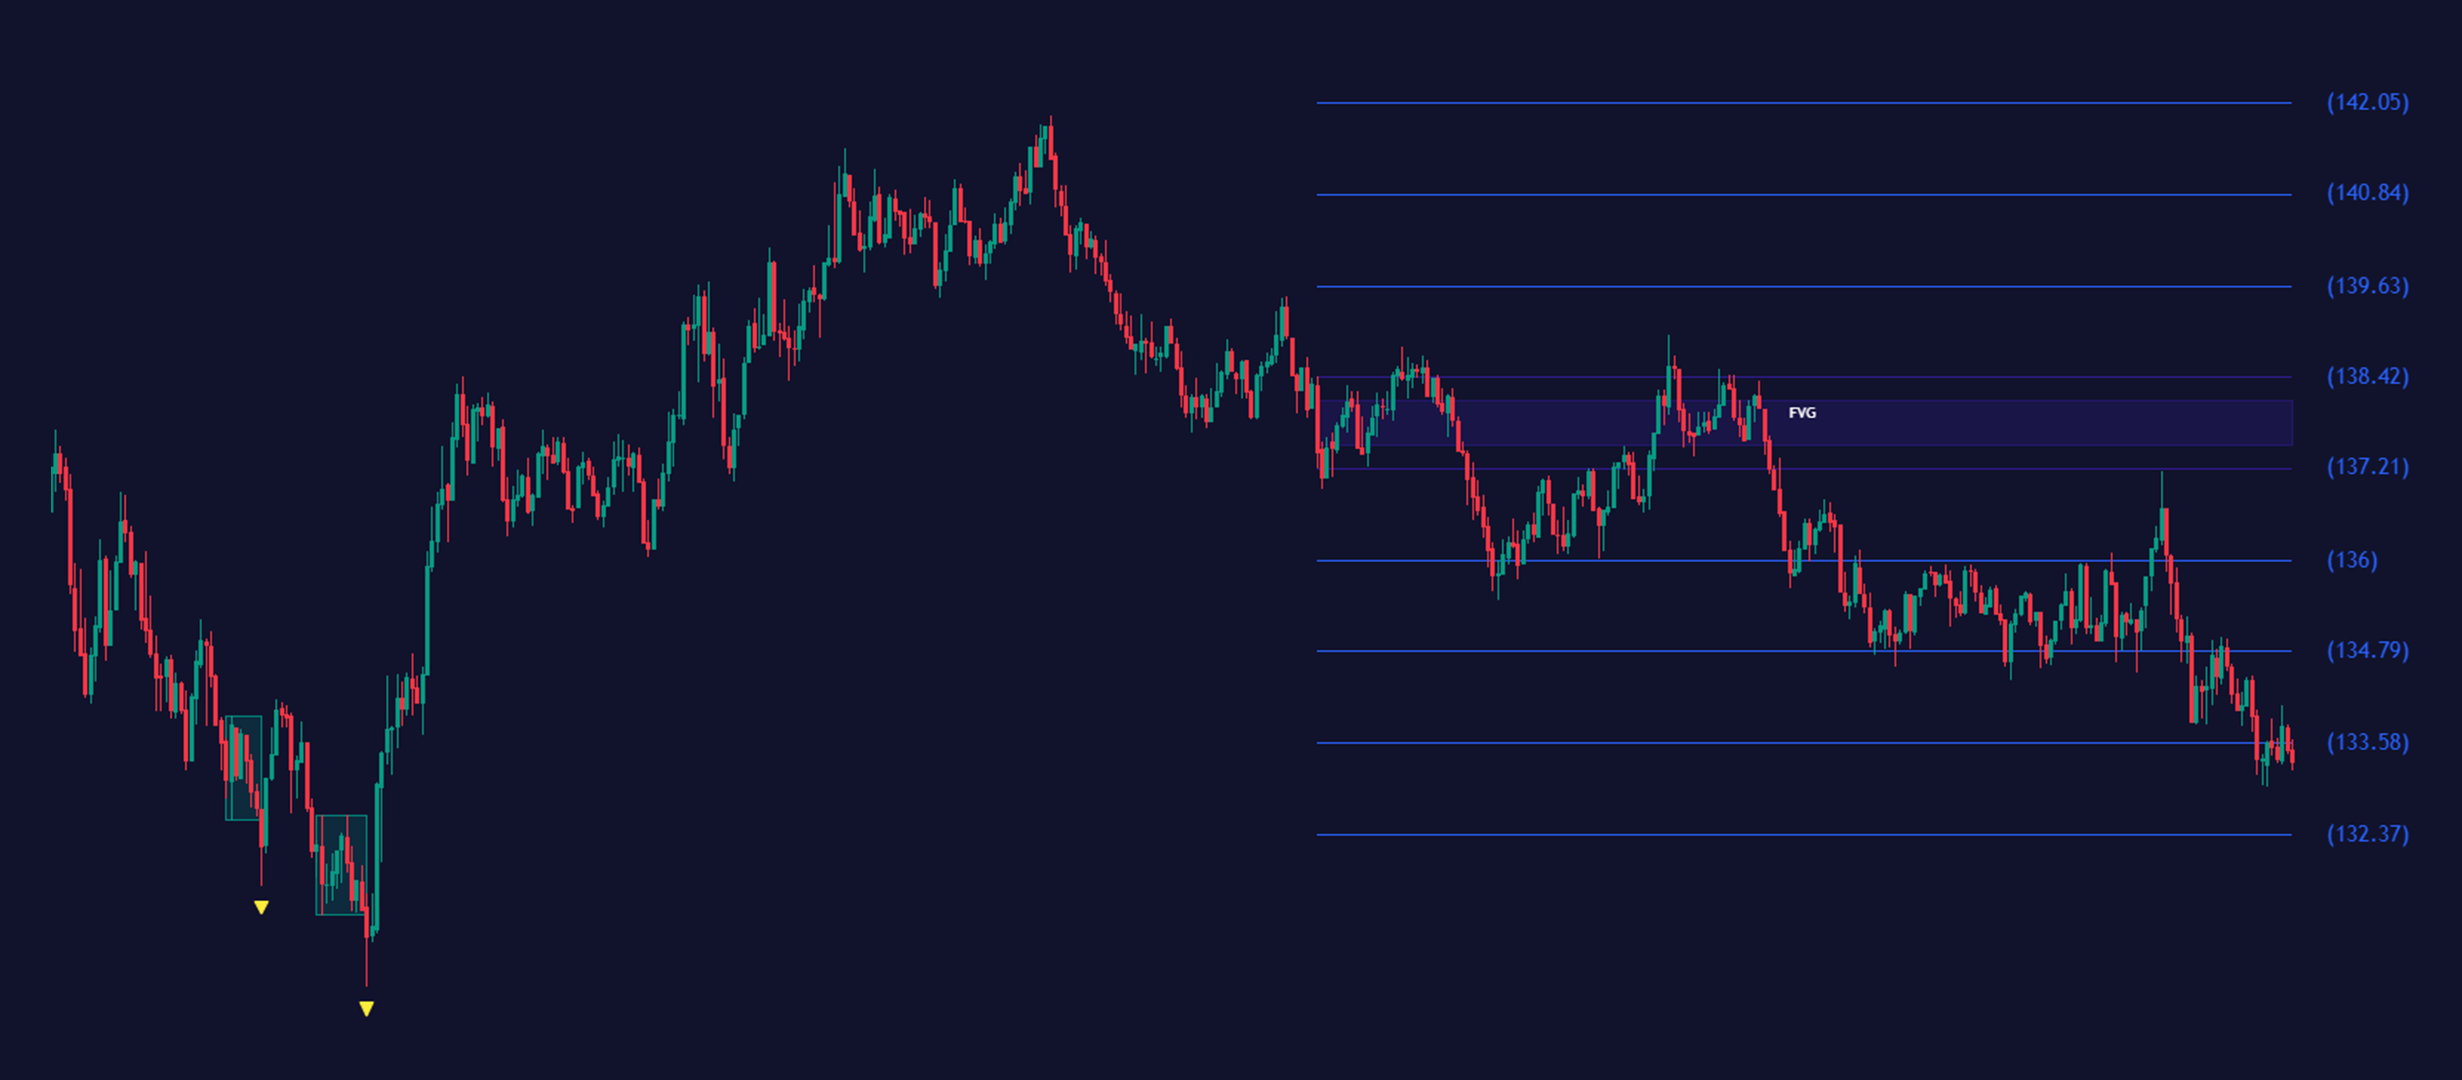
This highlights areas where the price has moved too fast without enough trading volume, leaving gaps in the market. These gaps might be targeted as potential reversal zones as the market often returns to these levels to ‘fill’ the gap.
How to Use: You can look for these specially marked candles to identify potential buy or sell zones. For example, suppose a significant price drop occurs on low volume and creates a gap.
In that case, the price will likely revisit this area once normal volume resumes, presenting a buying opportunity. Conversely, a low-volume price spike may indicate an unsustainable rally, suggesting a potential sell-off point.
Start using Institutional FVG & Liquidity Range Candle on TradingView!
8. Adaptive Moving Averages (AMA) Signals
This indicator adjusts its sensitivity based on the market volatility. AMA reacts faster to price changes than standard moving averages, which can help traders catch trends early and potentially enhance profit-making opportunities in fast-moving markets.
How to Use: Use the AMA to identify the direction of the trend. An upward moving AMA indicates a bullish trend, while a downward moving AMA suggests a bearish trend. Adjust the fast and slow EMA lengths to match the desired sensitivity and timeframe.
Start using Adaptive Moving Averages (AMA) Signals on TradingView
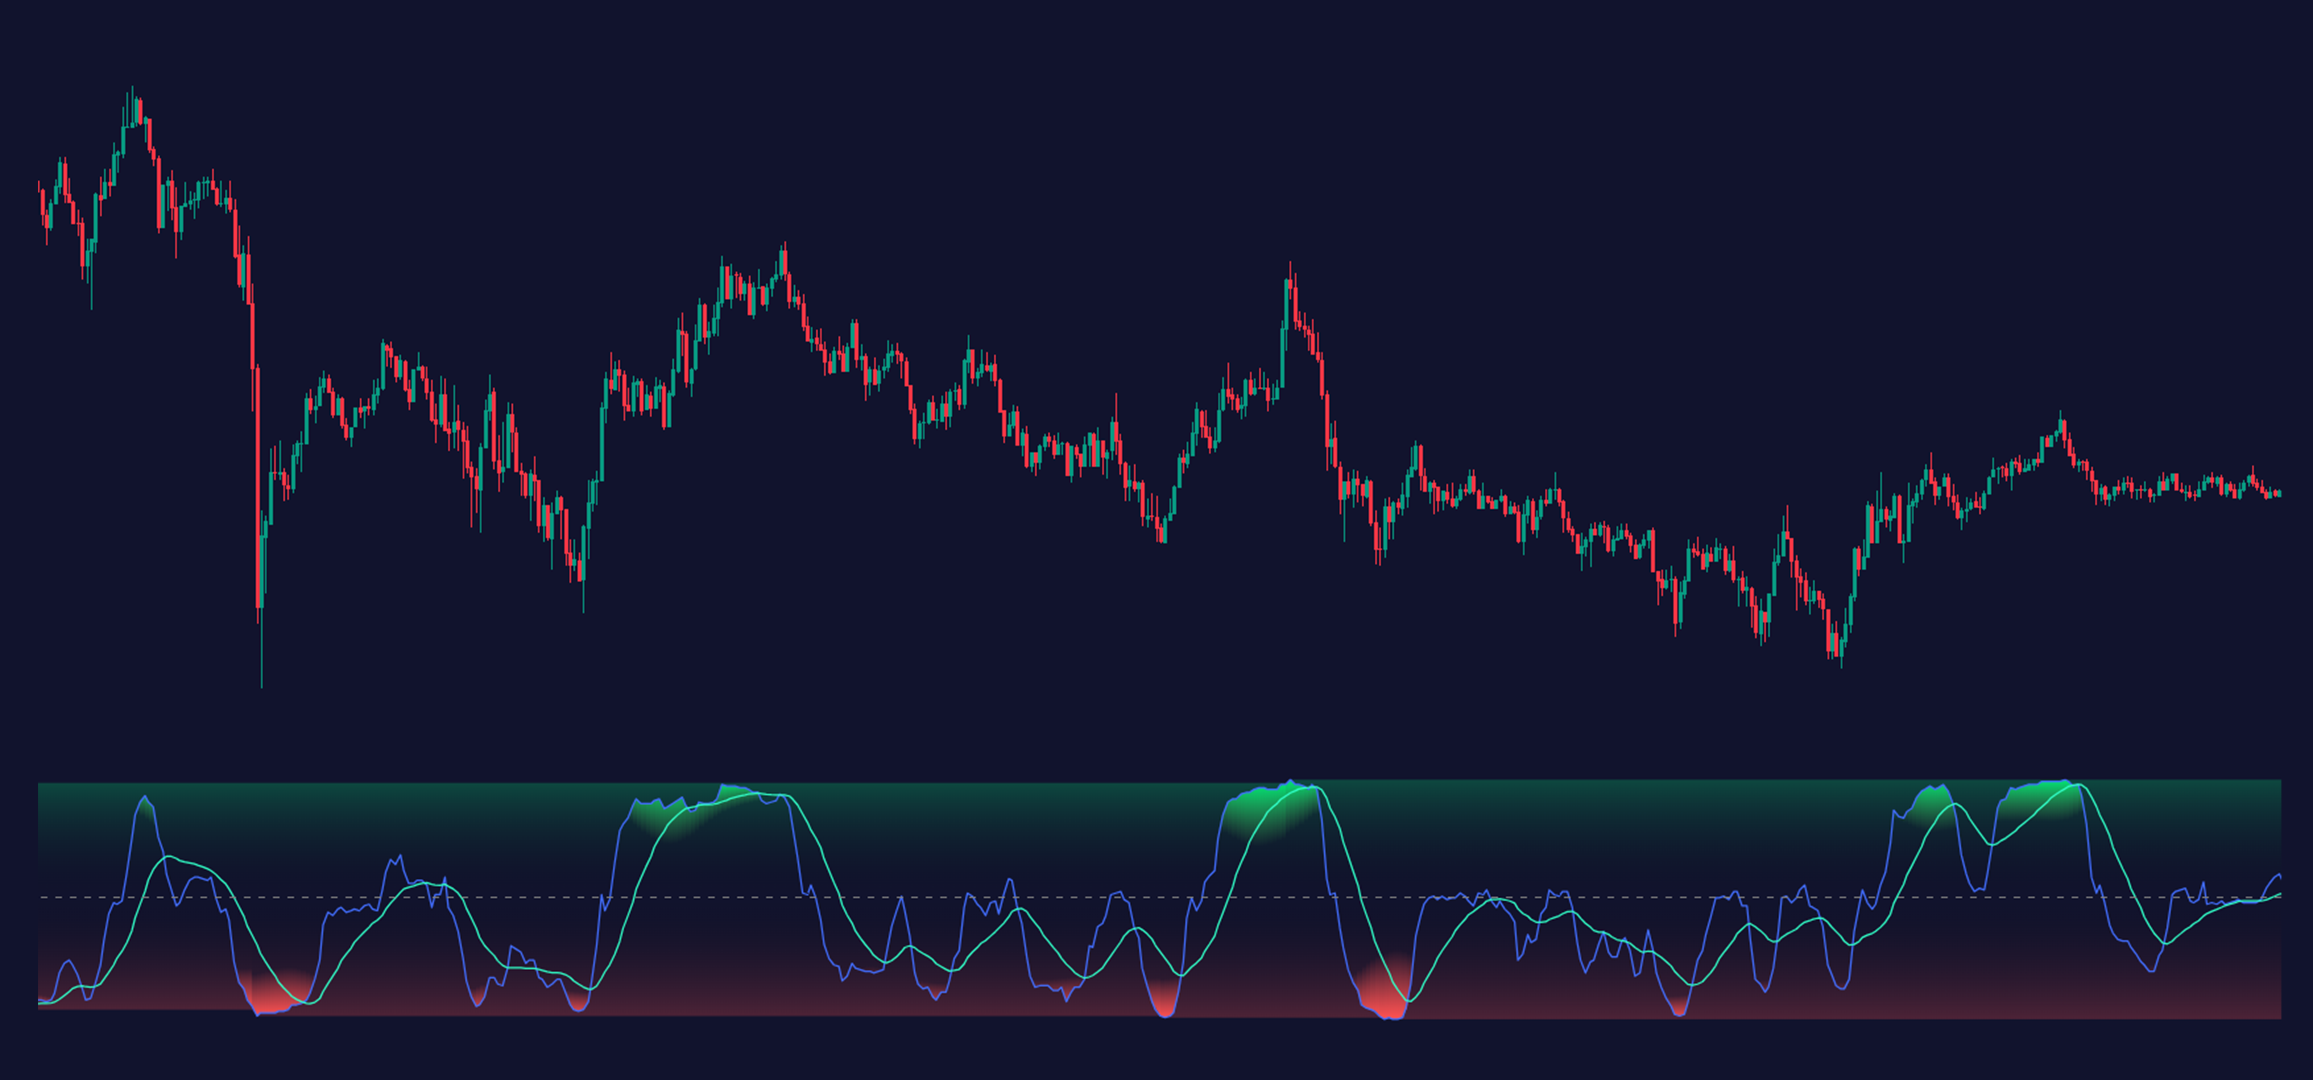
9. Peak Indicators, or Fear and Greed
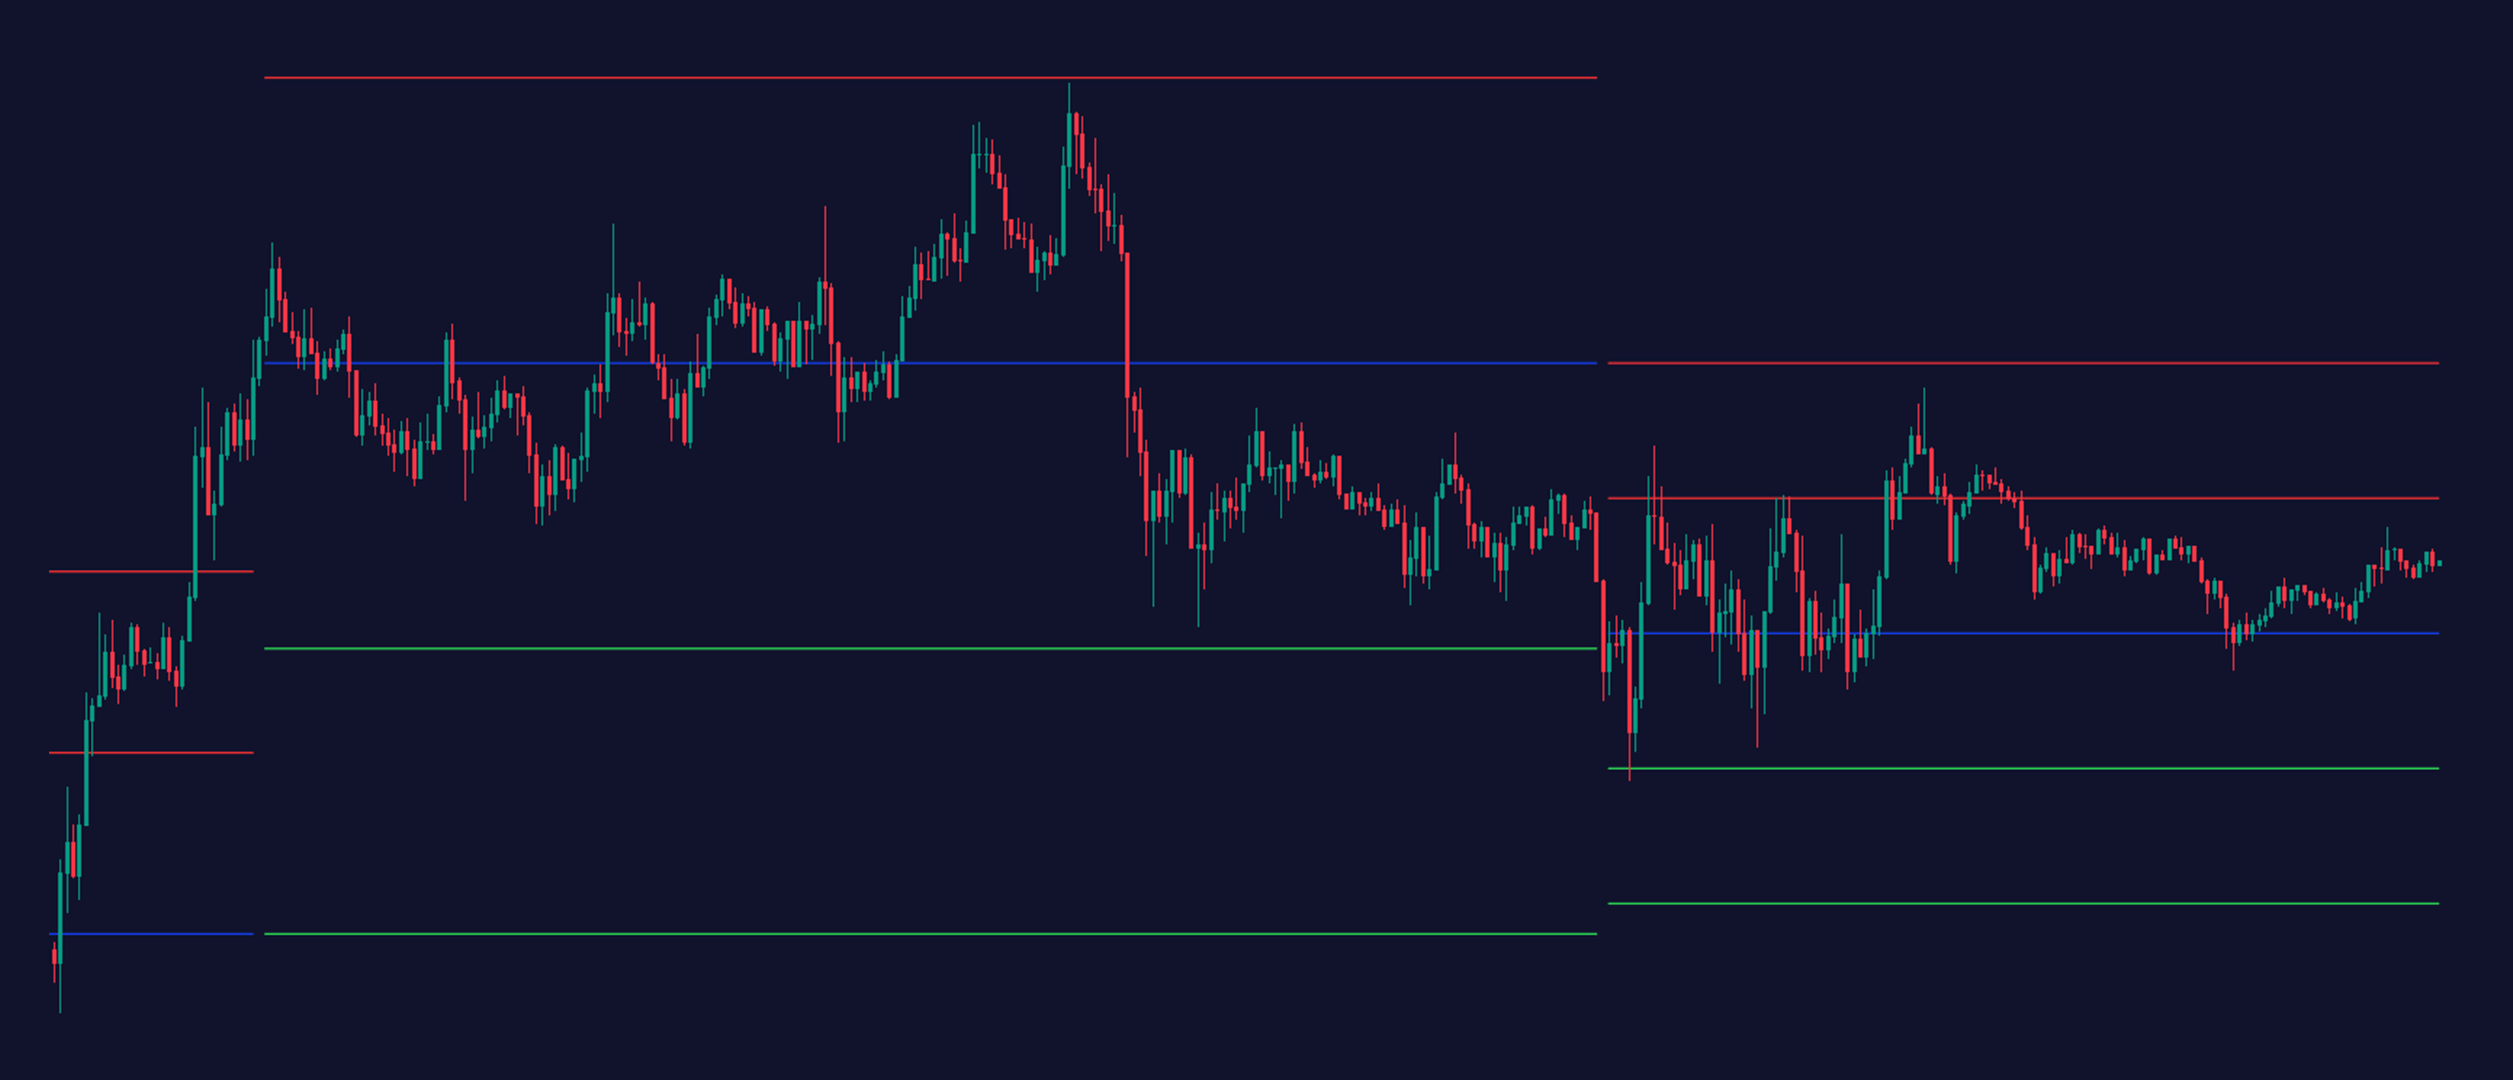
Fearzone Greedzone Levels Contrarian Breakout
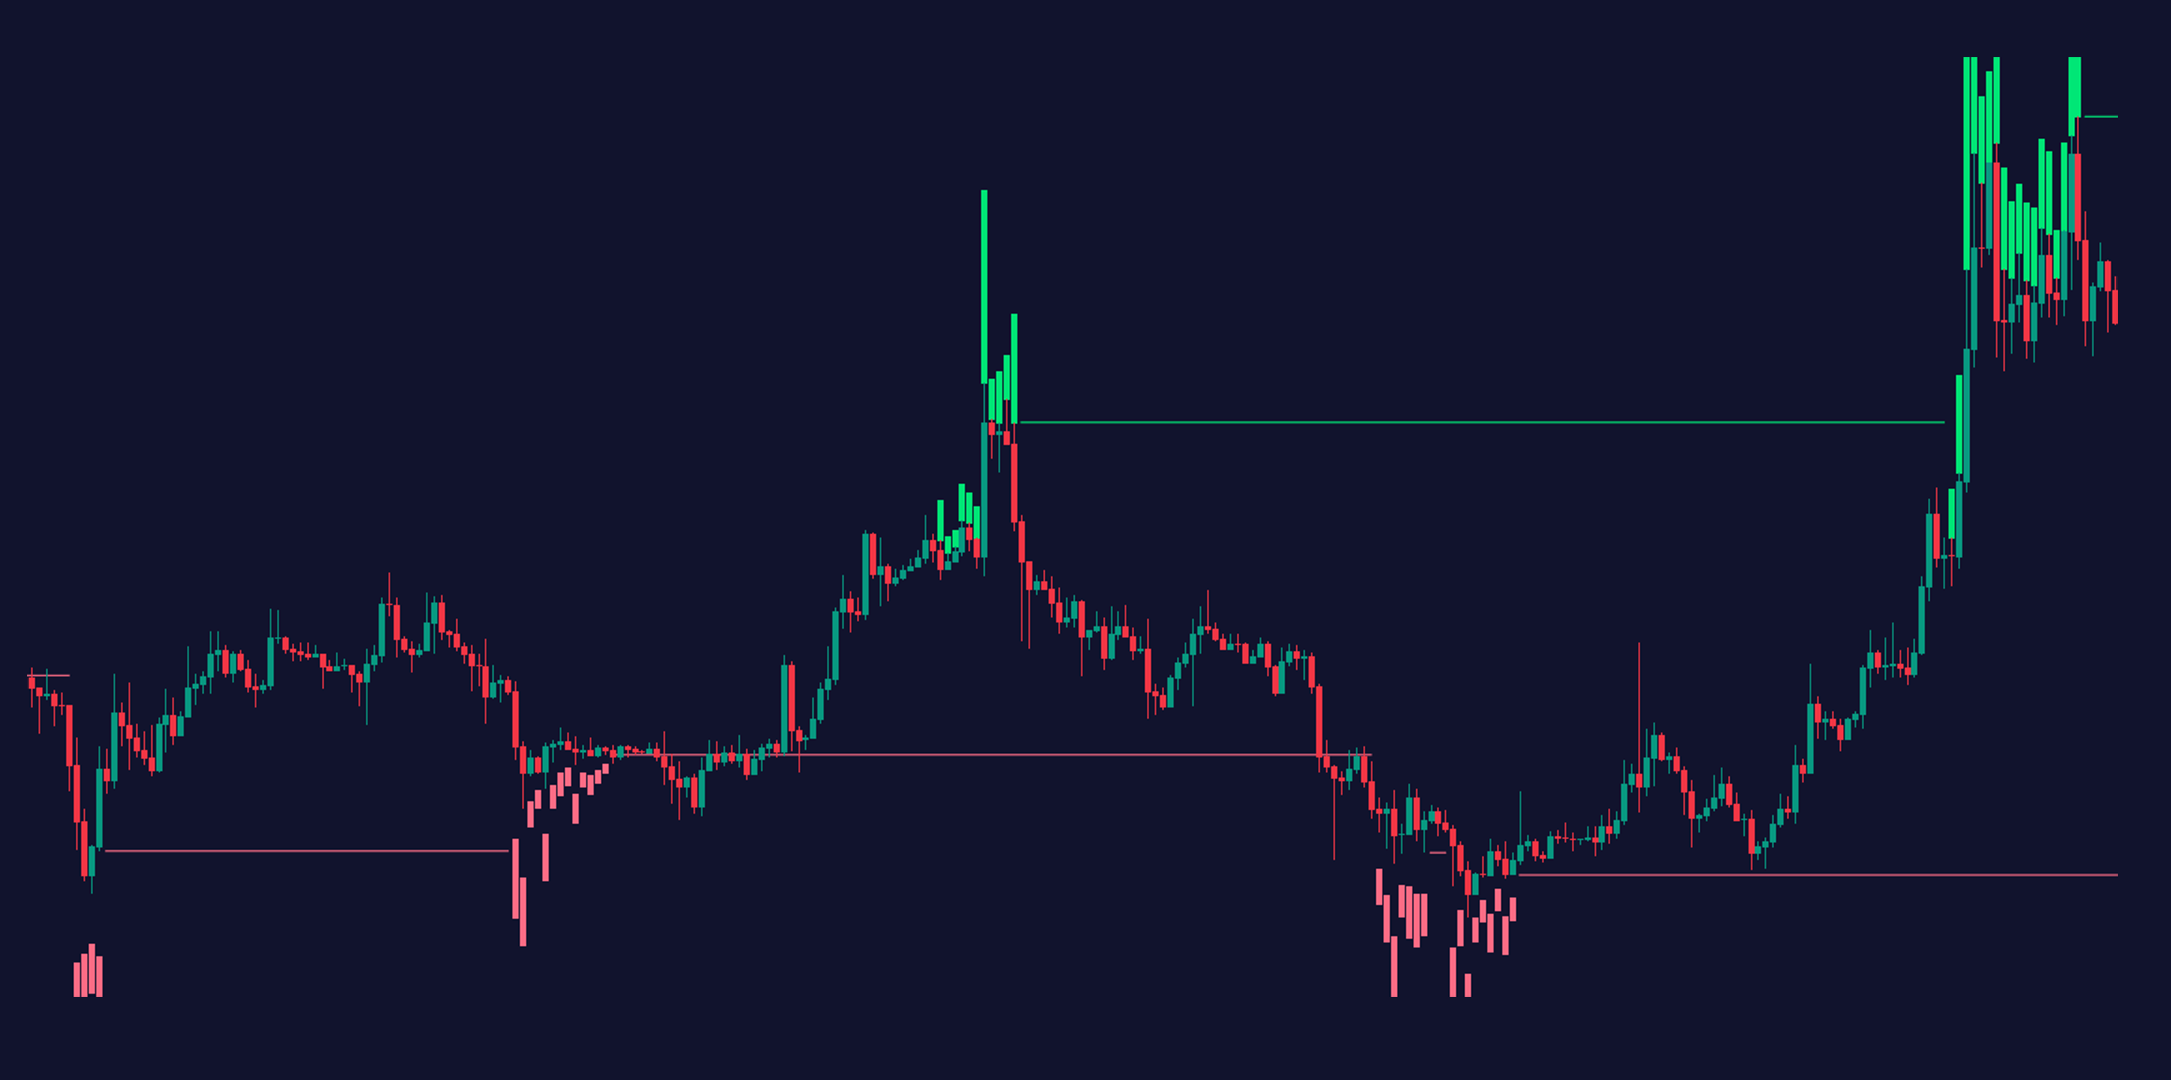
The Fearzone Greedzone Levels Contrarian Breakout indicator is designed to capitalize on extreme market sentiment, often indicated by peak fear or greed. This tool is essential for traders specializing in contrarian strategies.
If you don’t know what contrarian strategies are, it’s when a trader intentionally goes against prevailing market sentiments at key moments to capture potential reversals.
How to Use: This indicator marks the levels where market sentiment reaches extreme fear or greed, suggesting potential zones for contrarian entry points. You can use these signals to identify moments when the market sentiment is likely overextended.
Start using Fearzone Greedzone Levels Contrarian Breakout on TradingView!
Combining Indicators for Effective Analysis
Using these indicators in conjunction provides a more holistic view.
For instance, while the RSI might show an overbought condition, confirming this with an increasing OBV could suggest continued upward pressure on the price, rather than an imminent reversal.
Meanwhile, tools like the MLMI can be tuned to detect subtle shifts in momentum that might precede visible market moves, offering traders advanced warning.
Ultimately, the effectiveness of these indicators depends on their strategic application, taking into account the unique behaviors of the cryptocurrency markets such as sudden regulatory changes, market sentiment shifts, and macroeconomic factors that can dramatically influence market direction.
And you know what’s the best part about this list? This is just the tip of the iceberg. We have dozens of amazing indicators at Zeiierman (both free and premium) designed for you 🫵.
How about you check out some of our free indicators and pull your trading game up a notch?
Zeiierman
With over 16 years in the market, Zeiierman has extensive experience as a full-time trader and risk advisory consultant for hedge funds. He has developed many profitable trading strategies, drawing on his background in risk management and strategy execution.
More from Zeiierman