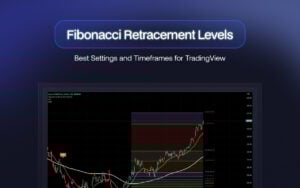
Fibonacci retracement levels are a great tool in technical analysis. They aren’t as common among beginners, but they should be. These retracement levels are excellent at identifying potential reversal points in the market.
The concept of Fibonacci retracement levels is rooted in the Fibonacci sequence, a series of numbers where each number is the sum of the two preceding ones. Named after the Italian mathematician Leonardo Fibonacci, this sequence begins with 0 and 1 and progresses as follows: 0, 1, 1, 2, 3, 5, 8, 13, 21, 34, 55, 89, 144, and so on.
In financial markets, the Fibonacci sequence is used to identify potential support and resistance levels. The key Fibonacci retracement levels are derived from the ratios between numbers in the sequence.
The levels that we use most commonly are 0.0%, 23.6%, 38.2%, 50%, 61.8%, 78.6%, and 100%. We discussed them a lot in our other article, ideal settings and timeframes for Fibonacci retracement levels.
Here’s how the Sequence is Applied in Financial Markets:
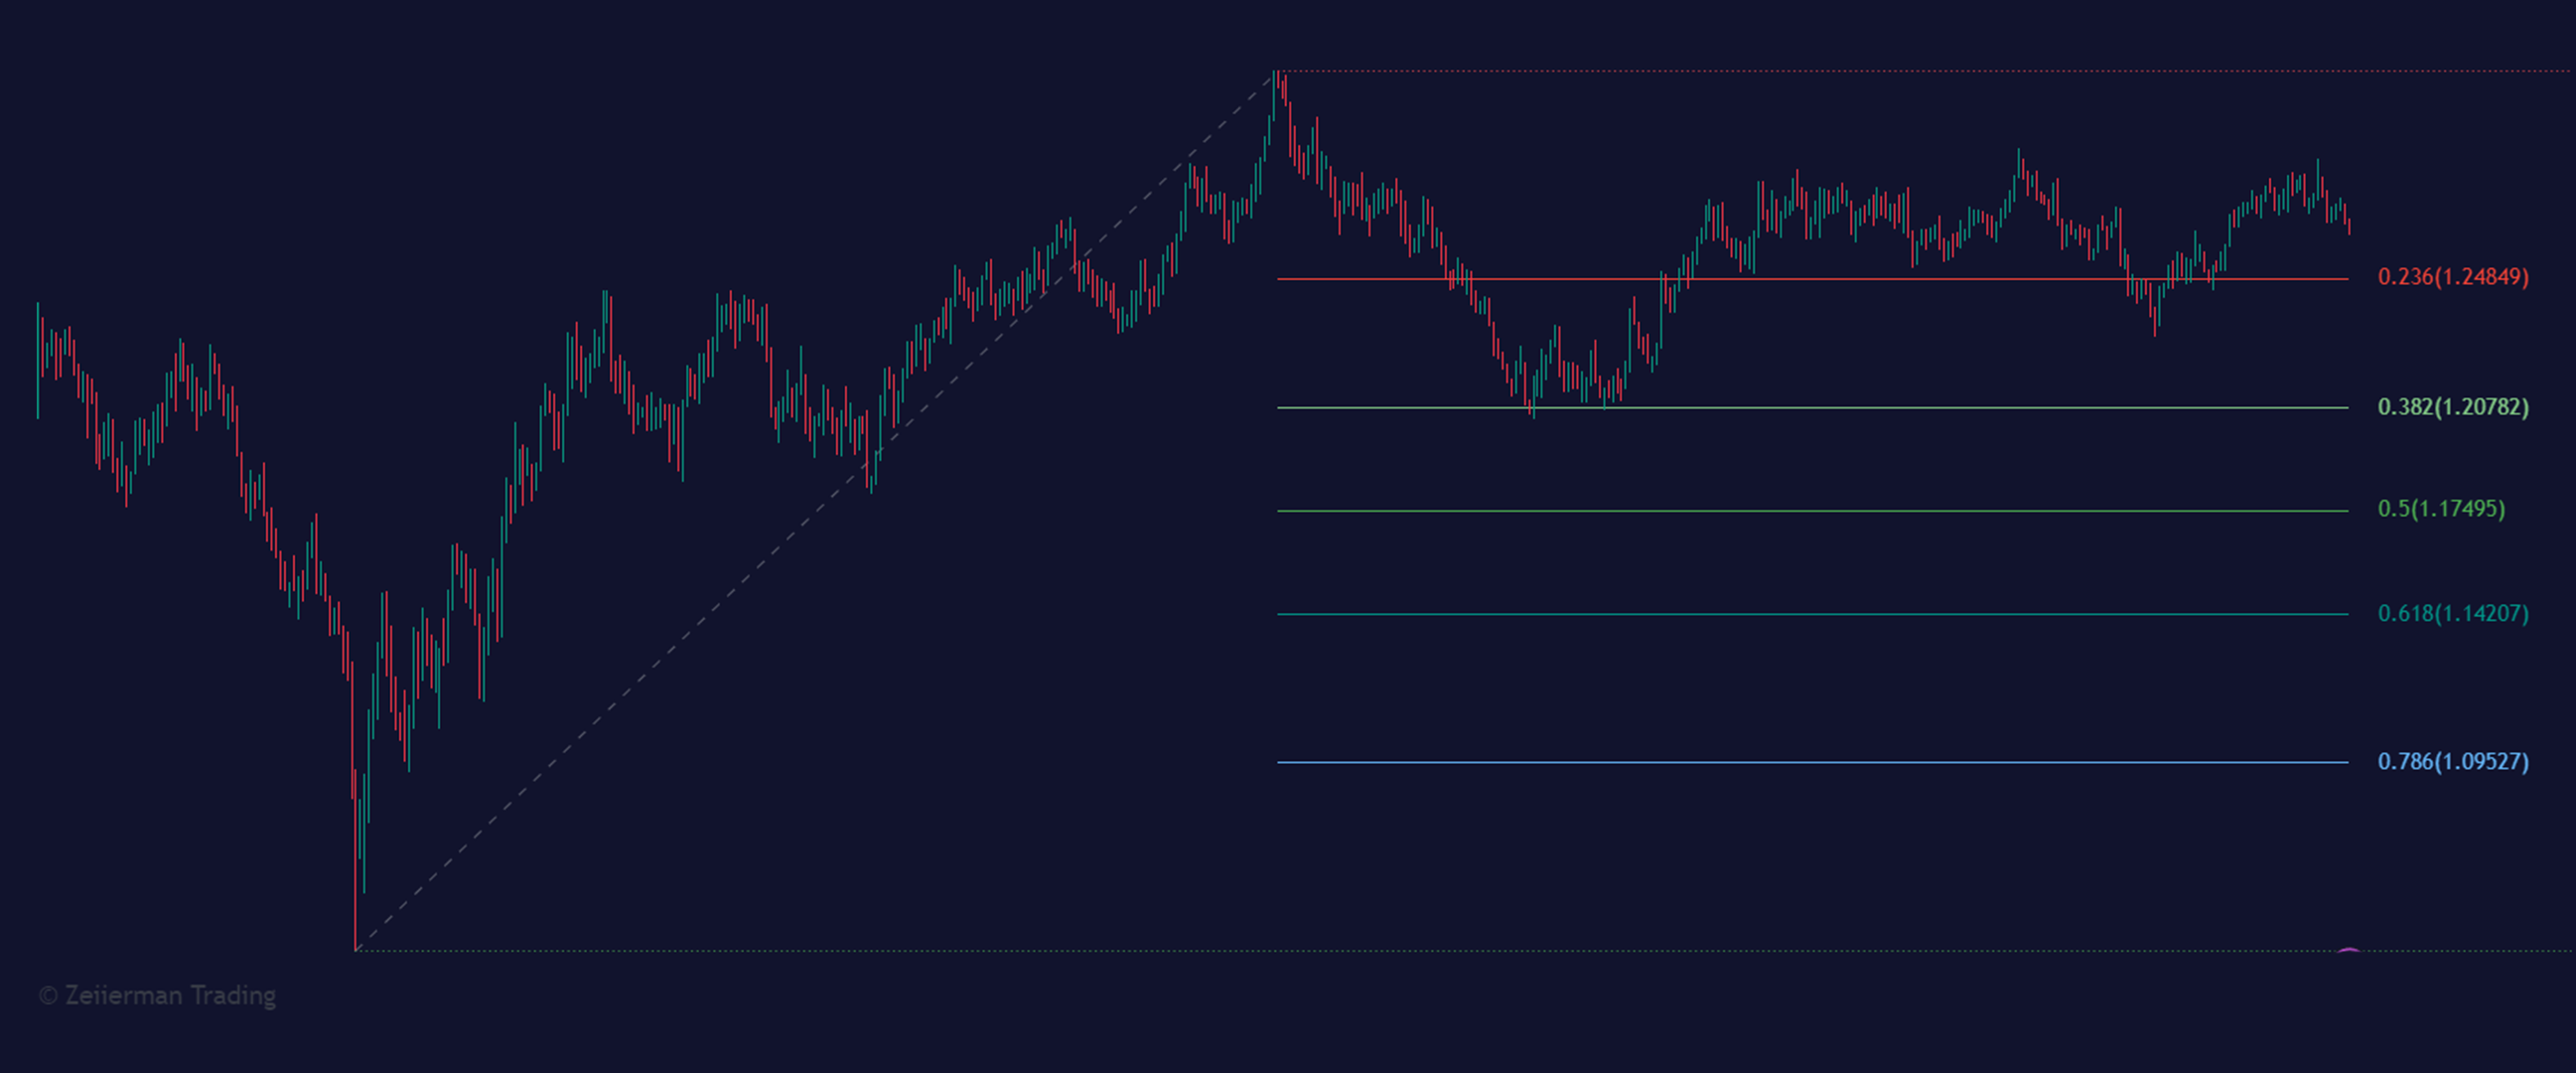
- 0.0% and 100% Levels: These levels represent the start and end of a significant price move. For instance, in an uptrend, the 0.0% level would be the lowest point, and the 100% level would be the highest.
- 23.6% Level: This is considered a minor retracement level, indicating a shallow pullback.
- 38.2% Level: Often the first significant level of support or resistance.
- 50% Level: While not a true Fibonacci level, it is widely used due to its psychological significance as a price range midpoint.
- 61.8% Level: The “golden ratio” is crucial as it often indicates a strong support or resistance point.
- 78.6% Level: This represents a deeper retracement, indicating significant pullback strength.
How to Calculate Price from Fibonacci Retracement Levels?
Fibonacci retracement levels are calculated using a simple formula based on the Fibonacci sequence. The key levels—23.6%, 38.2%, 50%, 61.8%, and 78.6%—are derived from mathematical relationships within this sequence.
Calculation for Stock Prices from Retracement Levels
Suppose the price of an asset moves from $100 to $200. The price range is $100.
- 23.6% Retracement: 100×0.236=23.6 → $200 – $23.6 = $176.4
- 38.2% Retracement: 100×0.382==38.2 → $200 – $38.2 = $161.8
- 50% Retracement: 100×0.5==50 → $200 – $50 = $150
- 61.8% Retracement: 100×0.618==61.8 → $200 – $61.8 = $138.2
- 78.6% Retracement: 100×0.786==78.6 → $200 – $78.6 = $121.4
Golden Ratio: The most important ratio in Fibonacci retracement is 61.8%, known as the golden ratio. It is derived from dividing a number in the sequence by the number that follows it (e.g., 55/89 ≈ 0.618).
Calculating Retracement Levels Themselves
If you’re someone who loves to get into the nitty gritty of finance like I do, here’s how retracement levels are calculated. (Feel free to skip if you aren’t interested.)
0% and 100%: The lowest and highest points of a stock within a specified timeframe.
23.6%: Derived from dividing a number in the sequence by the number three places to its right (e.g., 13/55 ≈ 0.236).
38.2%: Derived from dividing a number in the sequence by the number two places to its right (e.g., 21/55 ≈ 0.382).
50%: While not directly derived from the Fibonacci sequence, it is used as a midpoint level in retracement analysis.
78.6%: This is the square root of 61.8%.
Using Fibonacci Retracement Levels in Trading

1. Identify a Trend
Before drawing Fibonacci retracement levels, determine the prevailing market trend. An uptrend is characterized by higher highs and higher lows, while a downtrend features lower highs and lower lows.
2. Uptrend
Select the lowest point (swing low) and the highest point (swing high).
In an uptrend, you will identify the swing low as the lowest point before the price starts moving up and the swing high as the highest point before the price retraces.
Example:
- Swing Low: In the AAPL chart, the lowest point of the recent uptrend is at 18:30, where the price is approximately $189.38.
- Swing High: The highest point before the price retraces is around 19:00, reaching approximately $189.99.
3. Downtrend
Select the highest point (swing high) and the lowest point (swing low).
In a downtrend, you will select the swing high as the highest point before the price starts falling and the swing low as the lowest point before the price retraces.
- Swing High: In the AAPL chart, the highest point of the downtrend is at 17:30, where the price is approximately $190.20.
- Swing Low: The lowest point before the price retraces upward is around 18:30, where the price is approximately $189.38.
Here’s the link to our FREE AUTO Fib indicator. Read more how it works on the link above.
Drawing Fibonacci Retracement Levels on a TradingView Chart
If you understood the theory but don’t know how to actually operate this on TradingView, follow these steps:
- Activate the Fibonacci Indicator: Select the Fibonacci retracement tool on your trading platform.
- Draw the Levels:
- Uptrend: Click on the swing low and drag the cursor to the swing high.
- Downtrend: Click on the swing high and drag the cursor to the swing low.
- Adjust the Levels: The tool will automatically plot the key Fibonacci levels (23.6%, 38.2%, 50%, 61.8%, and 78.6%) on your chart.
Example:
- Suppose you analyze an uptrend where the price moves from $100 to $200.
- You select $100 as the swing low and $200 as the swing high.
- Drawing the Fibonacci retracement levels, you will see lines at $176.4 (23.6%), $161.8 (38.2%), $150 (50%), $138.2 (61.8%), and $121.4 (78.6%).
Tips for Accurate and Effective Use
- Identify Clear Trends: Use Fibonacci levels on clear and significant price movements.
- Use Logarithmic Scale: A logarithmic scale can provide more accurate retracement levels in volatile markets.
- Check Multiple Timeframes: Draw Fibonacci levels on multiple timeframes to identify the most relevant levels.
- Confluence: Look for confluence where Fibonacci levels align with other technical indicators to strengthen the signal.
Limitations of Fibonacci Retracement Levels
While Fibonacci retracement levels are a powerful tool, they aren’t end all be all in trading. Here are some of the key limitations:
1. Not Predictive on Their Own
Fibonacci retracement levels are not predictive by themselves. They do not indicate when a retracement will occur or how far the price will move in a given direction.
To increase the probability of successful trades, you must combine Fibonacci retracement levels with other technical indicators and market analysis.
Example: If AAPL retraces to 61.8%, it doesn’t guarantee a bounce. To validate the potential reversal, I would seek confirmation from other indicators, such as moving averages, RSI, or MACD.
2. Subjectivity in Selecting High and Low Points
Selecting the correct swing high and low points to draw Fibonacci retracement levels can be subjective.
Different traders might choose different points, leading to varying retracement levels on their charts. This subjectivity can result in inconsistent analysis and trading decisions.
To be fair, this will only affect you if you trade within a community. To get past this issue, you could always use our free FIB indicator, it select the best HIGH and LOW points for you in real-time.
3. Market Conditions
Fibonacci retracement levels may not be equally effective across all trading instruments. While they are widely used in forex, commodities, and stocks, their effectiveness can vary based on the characteristics of the specific instrument being traded.
In highly volatile markets, prices can move quickly through Fibonacci levels without respecting them as support or resistance.
Conversely, the levels might not provide significant trading opportunities in low-volatility or ranging markets.
4. False Signals from Lack of Historical Context
Fibonacci retracement levels can sometimes generate false signals. Prices may touch a Fibonacci level, giving the appearance of support or resistance, only to break through shortly after.
Suppose, Tesla stock retraces to the 38.2% level and shows initial signs of support. However, without additional confirmation from other indicators, the price might break below this level, resulting in a false signal and potential losses if you entered.
This happens because Fibonacci retracement levels are based purely on mathematical relationships and do not consider historical price action or context.
Zeiierman
With over 15 years in the market, Zeiierman has extensive experience as a full-time trader and risk advisory consultant for hedge funds. He has developed many profitable trading strategies, drawing on his background in risk management and strategy execution.
More from Zeiierman