You might not hear “ICT” as often as you might hear other trading methods, but you can bet your bottom dollar that it’s pretty important.
Inner Circle Trading, or simply ICT, is the brainchild of Michael Huddleston, also known as the Inner Circle Trader. It amalgamates fundamental market concepts and trading strategies that Michael has shared and gained a strong following worldwide.
With a vibrant community, ICT trading continues to evolve every day. So, let’s dive into what Inner Circle Trading is all about and, more importantly, all you need to know to start ICT trading!
ICT and Smart Money Concepts (SMC)
SMC stands for “Smart Money Concepts.” It’s all about understanding how the big players in the market, like banks and hedge funds, operate. We’re talking about the savvy institutional traders who often have a big say in market movements.
Why does SMC matter in ICT, you might ask? Good question. We try to watch what the smart money folks are up to, spot patterns of accumulation or distribution, sniff out potential market manipulation, and even anticipate when trends might shift.
The goal is to align our trading strategies with the actions of these big players, which can give us a serious edge in navigating the financial markets’ ups and downs.
You can take a look at our Free Smart Money Concepts Indicator to try your hand on these concepts right away. Here’s some documentation if you wanna read first.
A Beginner’s Guide To ICT – Key Concepts
1. Swing Highs and Swing Lows
These are the fundamental teachings of ICT strategy.
- A swing high refers to a point in the candlestick chart where the immediate neighbors of a candle have comparatively lower highs.
- Swing Lows, as the name suggests, are the opposite of swing highs, with the immediate neighbors of a candle in a 3-candle sequence having higher lows.
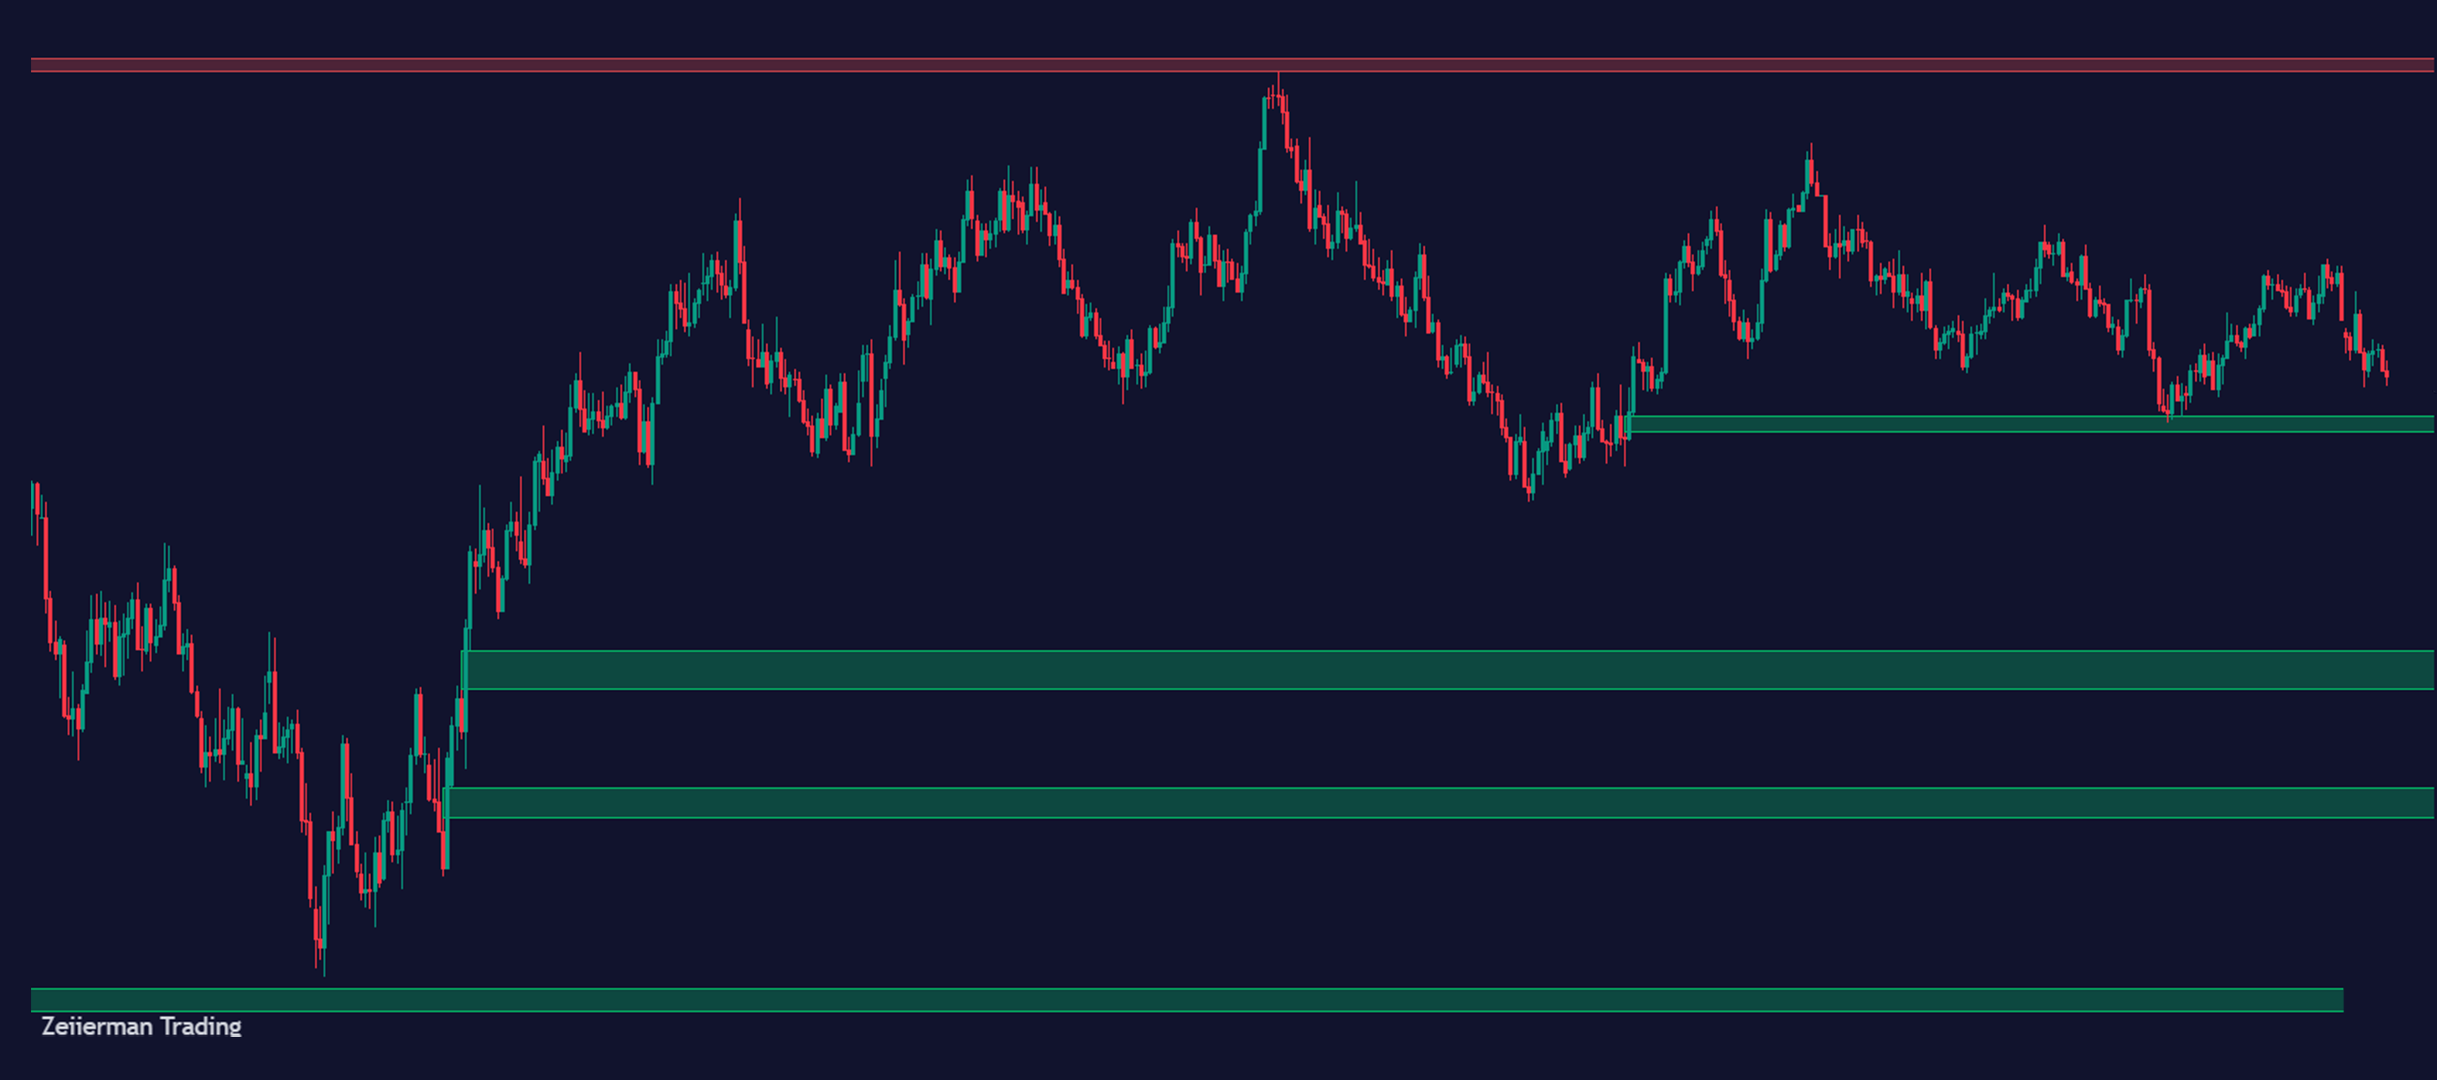
2. Liquidity
Liquidity is the backbone of the ICT methodology. Liquidity means the ease of acquiring an asset without significantly altering its market price.
Swing points are where retail traders are interested in selling and buying, resulting in higher liquidity around them. There are two liquidity zones: the buy side and the sell side.
Buy-side Liquidity consists of traders placing their stops at the swing-high wishing to short for a profit and traders willing to enter a long trade expecting the price to go up.
Sell-side Liquidity is made up of traders who want to enter long trades and put their stop-losses at the swing low. Alternatively, you also have traders here who are waiting to enter a short position, hoping for the price to drop below the swing low.
On that note, we have an awesome indicator that helps you check buyside sellside liquidity in real time.
3. Displacement
Displacement is a significant price shift that disrupts existing patterns or trends. It’s a strong price movement caused by major market forces.
It is easy to identify displacements by looking at the candlestick chart. Look for a series of long candles with short wicks—that’s it—that’s the displacement!
Displacements either indicate a trend reversal (a move against the current trend) or a trend continuation (a strong move in the same direction as the current trend).
These displacements, as you may have guessed, are caused by major news events, institutional trading and shifts in market sentiment.
4. Discount and Premium
To understand the concept of discount and premium, you must learn what a “Range” is. A range is the gap between a swing low and the successive swing high and vice versa.
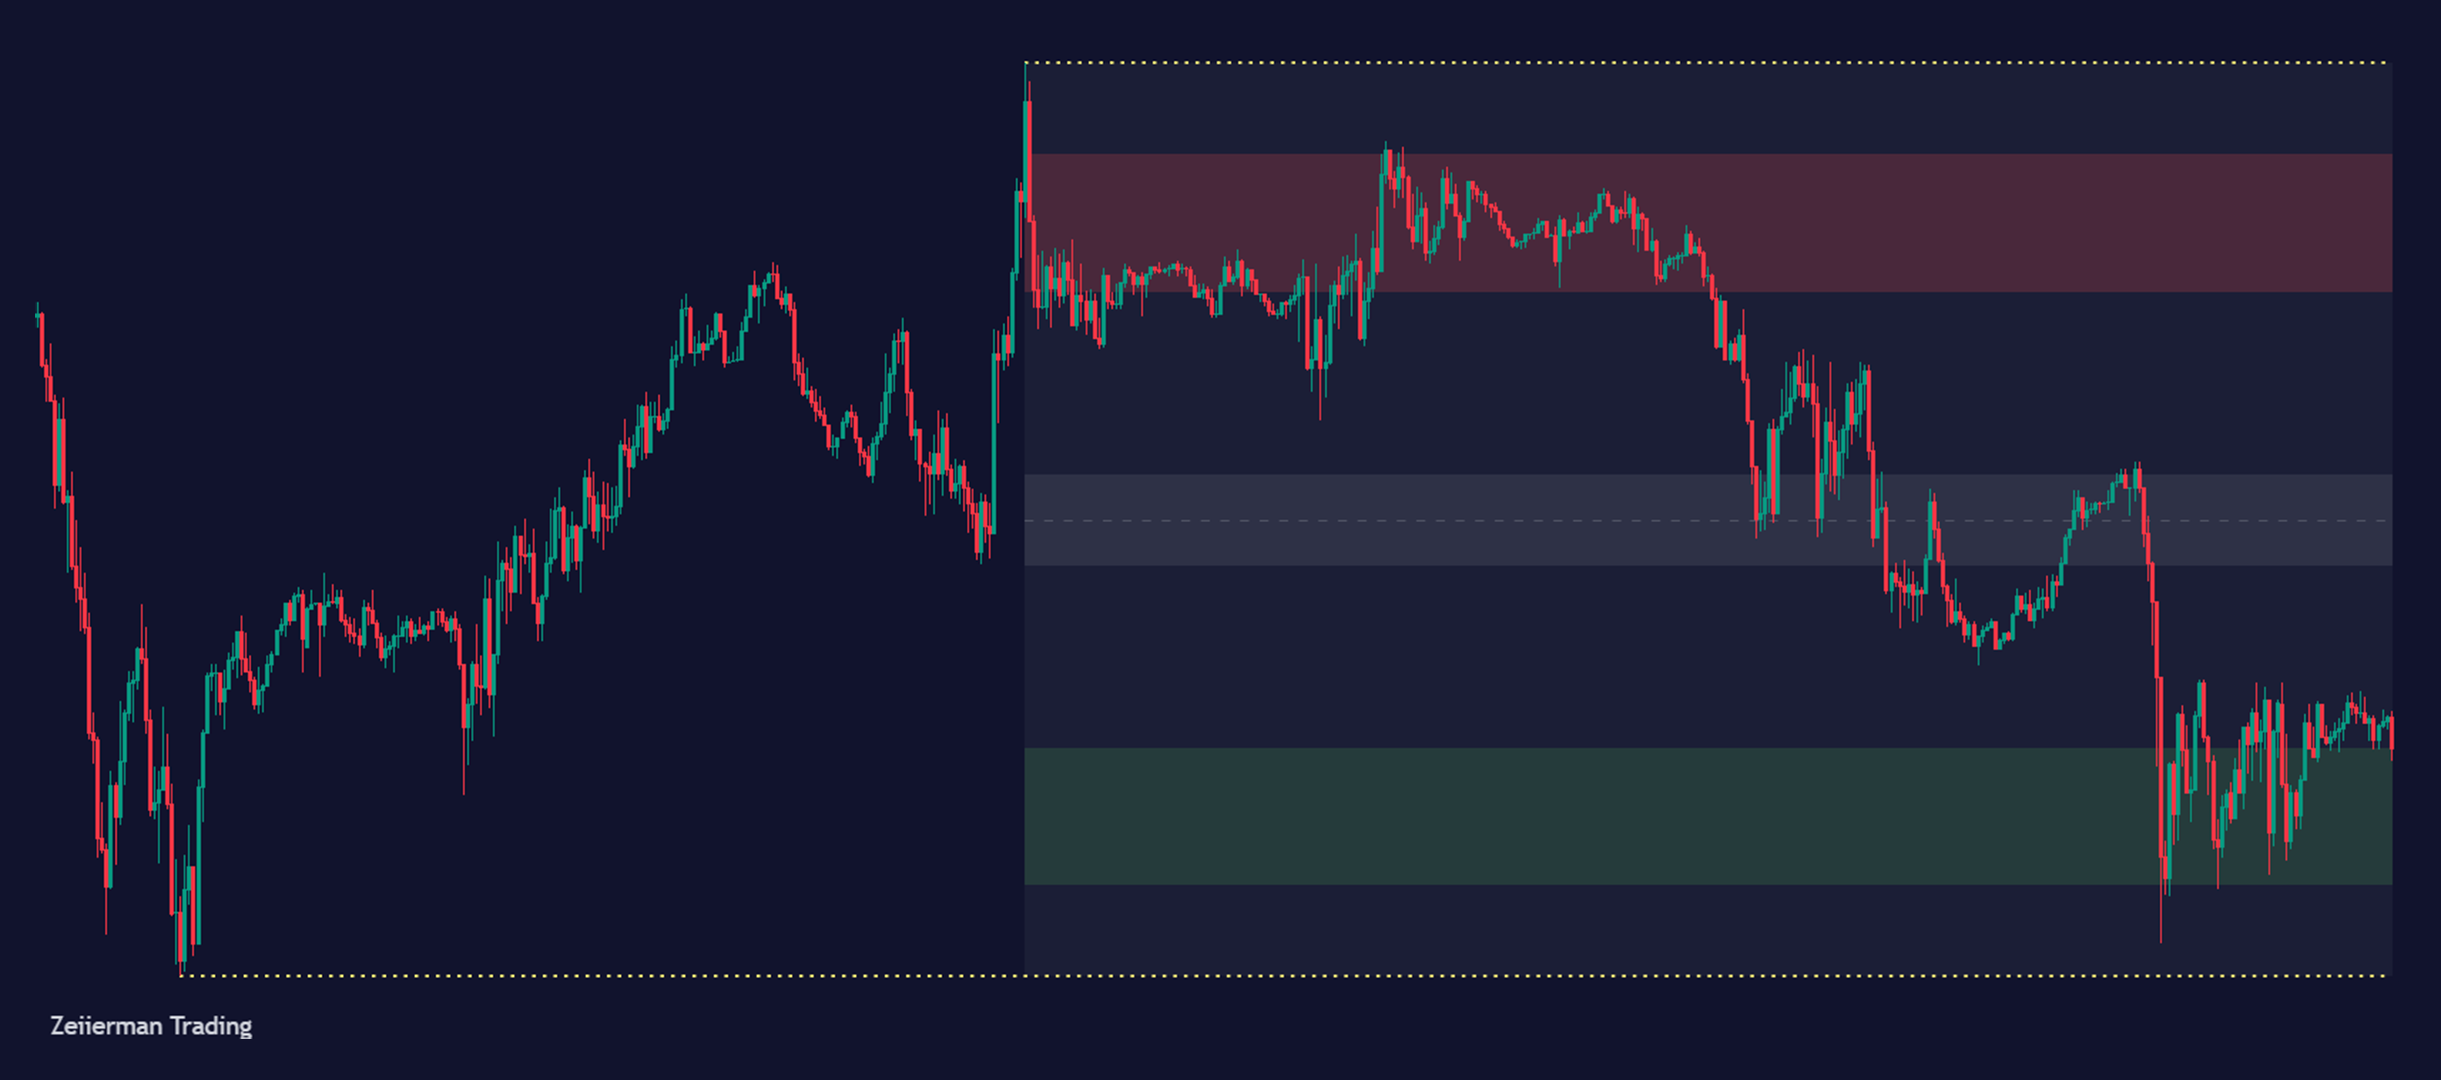
The discount and premium zones are derived by dividing the total range into halves. The upper half is called the premium zone, and the lower is called the discount zone.
Long Orders
Once the overall market sentiment is bullish, you can set up a long order with the entry point in the discount zone. The upper limit of the range serves as the take-profit, and the lower limit is the stop-loss.
The lower you enter the trade in the discount zone, the better your risk-to-reward ratio. A rule of thumb is to aim for a 1 to 3 risk-reward ratio.
Short Orders
When a bearish displacement forms a swing low, it is time to identify the premium and discount zones. Traders can now set up a short order with the entry point in the premium zone and the take-profit and stop-loss being the lower and upper limits of the range.
My two cents from personal experience: Remember that Discount and Premium should not be used standalone; it is important to consider other factors that affect the market.
Another common rookie mistake is using the premium and discounts in short time frames; these work best with 15-minute charts and higher. Chaotic, volatile markets are also a big no-no.
5. Optimal Trade Entry
The concepts of discount and premium are central to another ICT concept called Optimal Trade Entry (OTE).
OTE uses the Fibonacci Retracement concept along with the usual discount and premium zones. The OTE zone consists of the 0.62, 0.79, and 0.705 (the midpoint of 0.62 and o.79) Fibonacci levels.
Why Fibonacci levels? Because these levels are strong indicators of a price reversal.
The OTE will lie in the premium zone for short orders, where the candle will touch the uppermost Fibonacci retracement level but won’t close above it.
It will lie in the discount zone for long orders, where the candle will touch the lowermost Fibonacci retracement level without closing below it. Using the concept of OTE to determine your entry point assures a good risk-reward ratio.
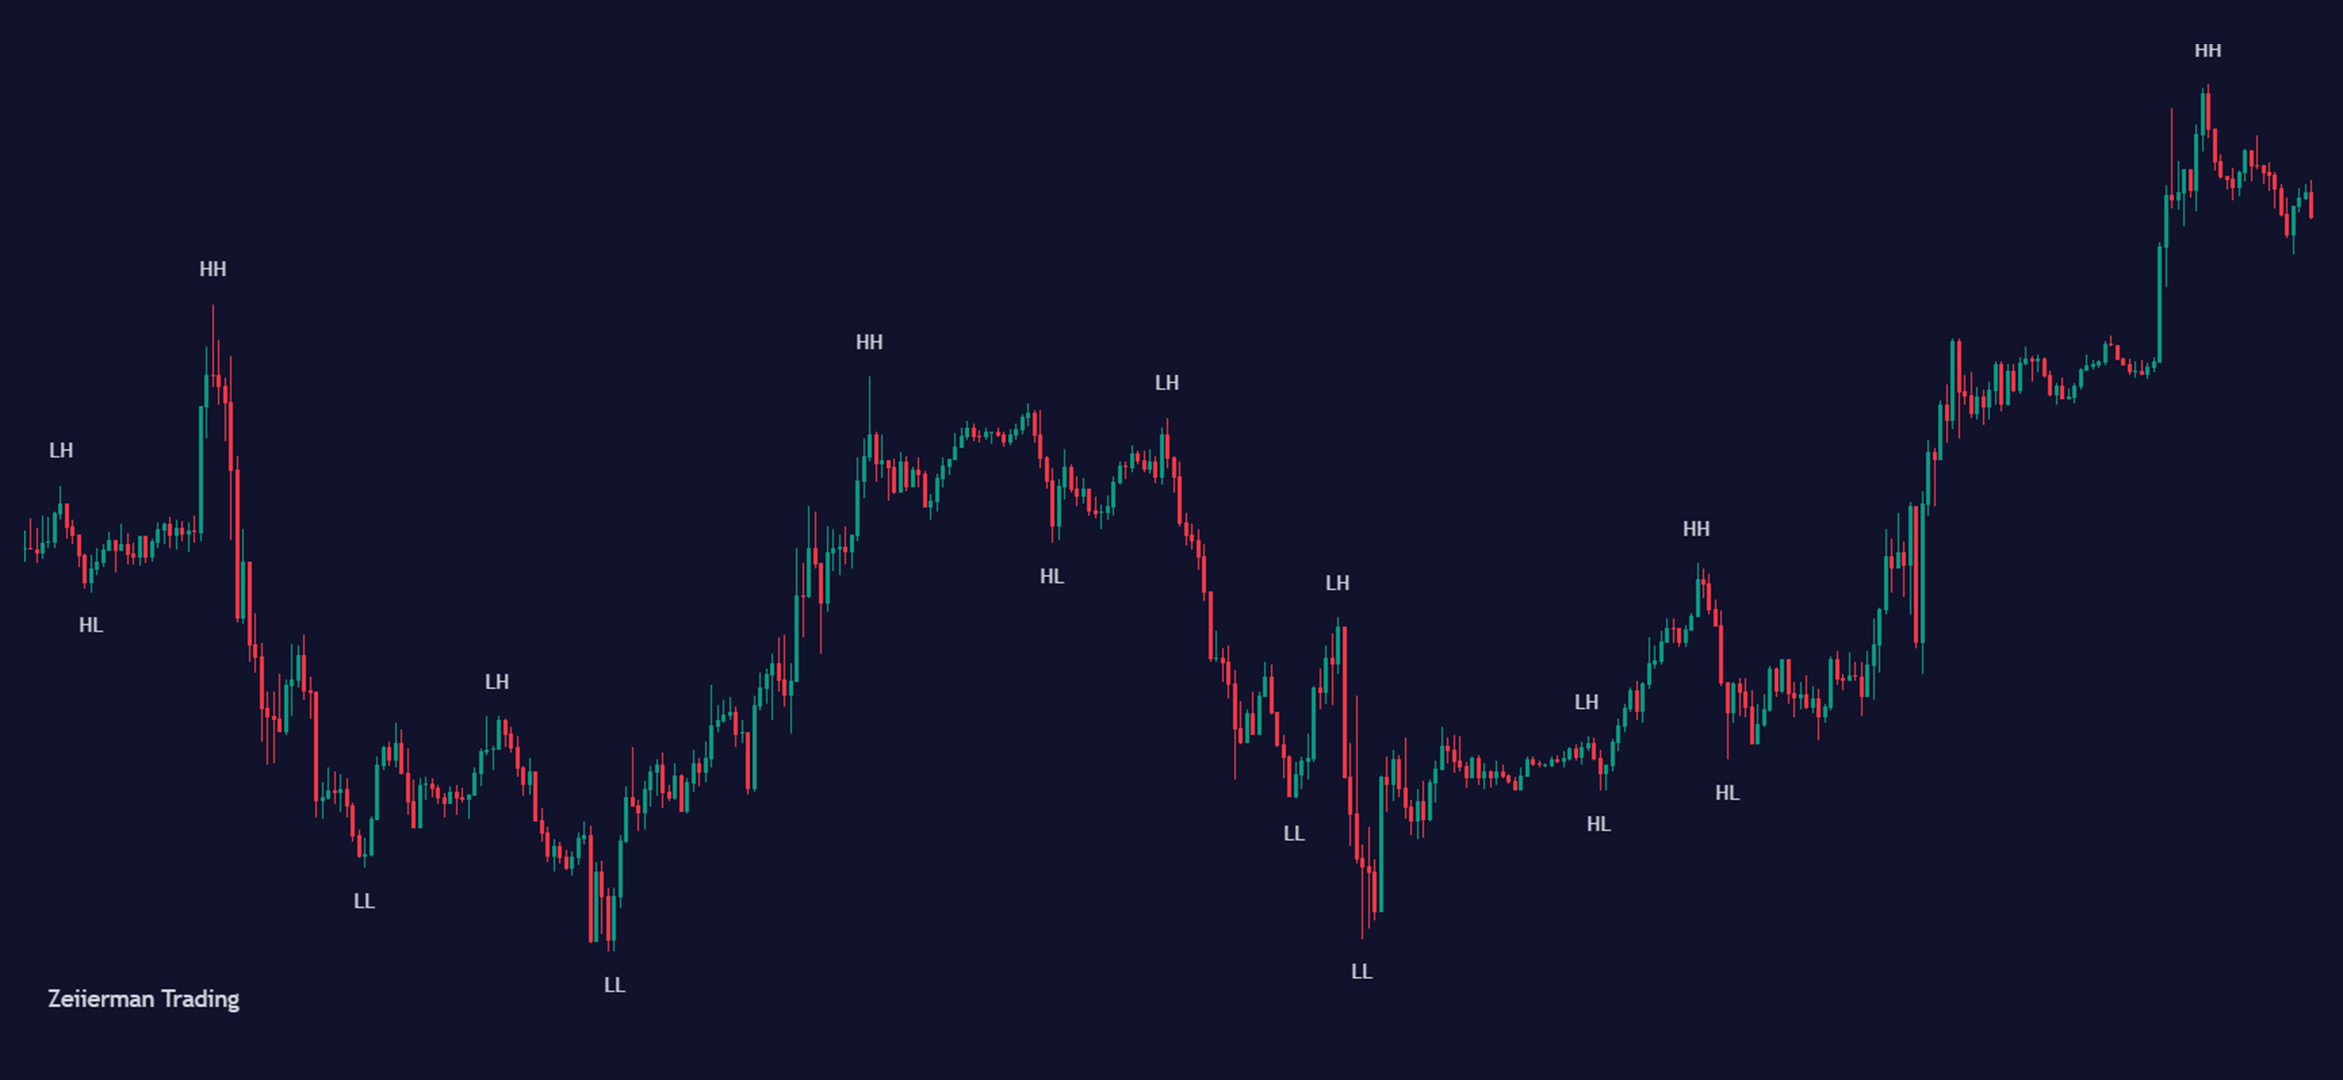
6. Market Structure Shift
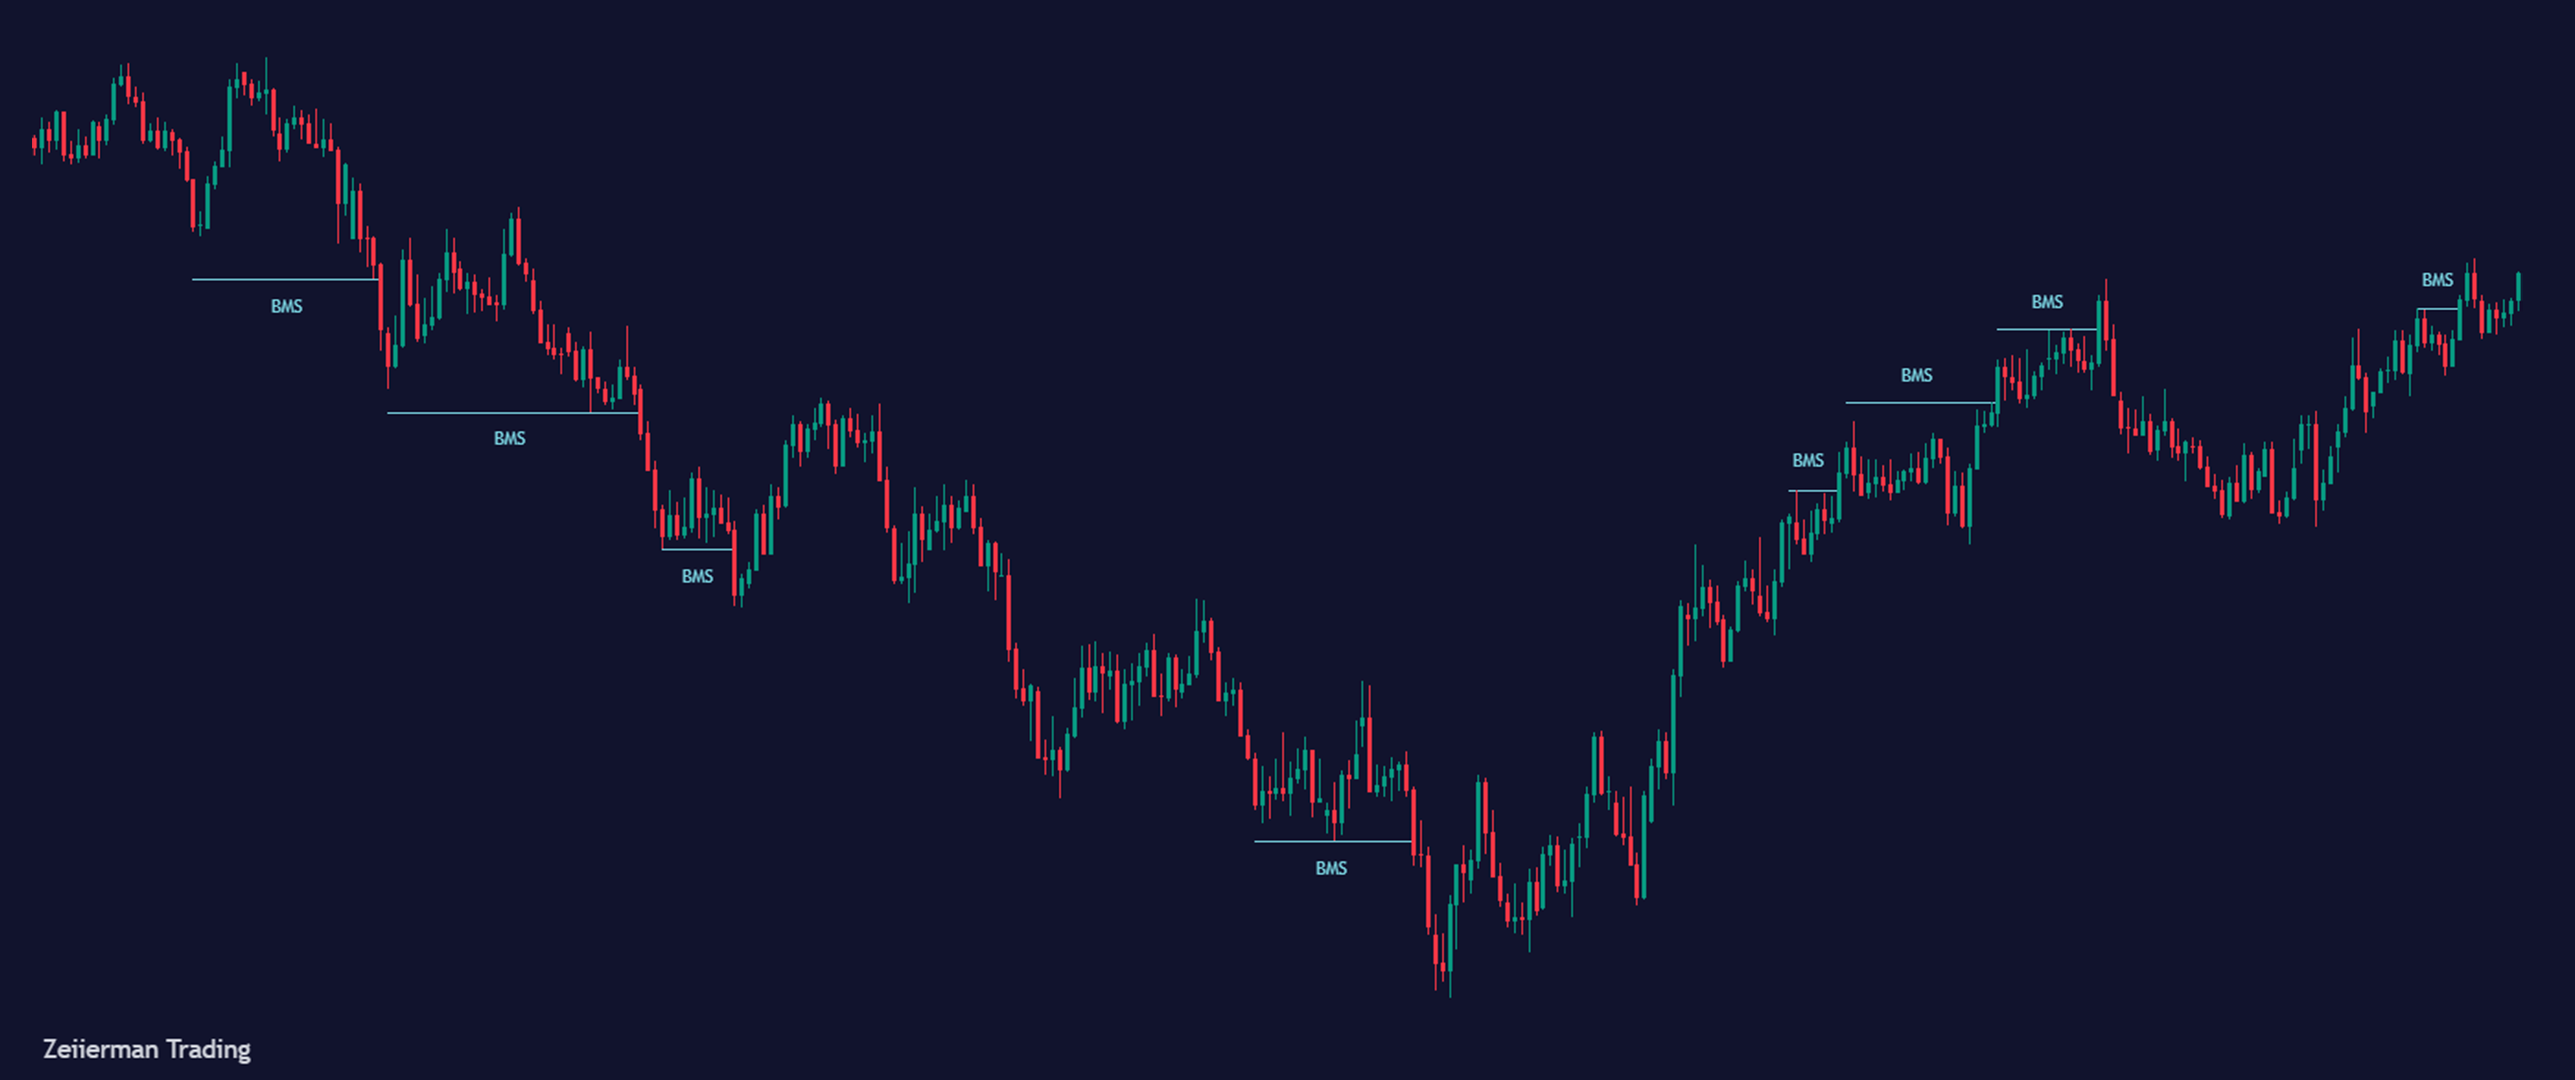
A market structure shift occurs when there is a significant change in the trend or pattern of an asset’s price action.
It signals that the market is moving from one phase to another — like switching from a bullish trend to a bearish one or from a range-bound market to a trending market.
Signs of a Market Structure Shift
- Uptrend/Downtrend Reversal: A shift occurs when the market goes from an uptrend (higher highs and lows) to a downtrend (lower highs and lows) or vice versa.
- Break of Structure (BOS): It occurs when the price breaks through a significant support or resistance level previously held, signaling a change in market sentiment.
7. Inducement
Inducement in ICT trading refers to market moves designed to lure traders into likely wrong positions.
These movements act as traps, tempting traders to make quick decisions based on perceived patterns or signals, only for the market to reverse direction.
Signs of Inducement
- False Breakouts: These are price movements that break through support or resistance levels, convincing traders to enter trades, only to reverse direction shortly after.
- Liquidity Traps: The market may move to areas where liquidity is concentrated (e.g., around significant price levels where many stop-loss orders are placed) to induce traders to take positions, which are then taken out as the market reverses.
Contrarian Moves are movements against the prevailing trend that trick traders into thinking a reversal is happening, only for the market to resume its original trend.
8. Fair Value Gaps
If you notice a price bump in a chart, sometimes, there’s a little gap instead of an overlap between the first candle’s high and the third candle’s low.
This gap is called a Bullish Fair Value Gap or simply “BISI.”
Why is a fair value gap important for you as a trader? A fair value gap represents an imbalance caused by smart money entering the market. These gaps serve as potential support and resistance, which makes them attractive to ICT trading enthusiasts.
Similarly, we have “SIBI,” the gap between the first candle’s low and the third candle’s high.
How to Use Fair Value Gaps
Since fair value gaps act as supports and resistances, how you use them is somewhat similar. Once a fair value gap is formed, price action might “react” to it. Whoosh, right?
Don’t worry. Let me explain in detail using a concept called consequent encroachment.
“Consequent Encroachment” (CE) refers to the midpoint of a fair value gap. Here is how you can use fair value gaps to your advantage:
- Observe the chart and figure out the fair value gaps
- Keep an eye on price action
- When the candle wick pierces the FVG but closes above/below it, the FVG is said to act as a support/resistance.
- The same phenomenon can be observed for the CE (i.e., price pierces through the CE yet closes above/below it)
Much like conventional support and resistance, reversing holds for fair value gaps. This phenomenon is called an “FVG Inversion”.
Fair value gaps are easy to figure out per se but always remember that concepts in ICT are rarely useful standalone.
The Four Candle Sequence
Both the examples above are 3 candle sequences, but there is an exception that shows up often.
When the first candle in a 3-candle sequence is preceded by a bigger candle with a higher high and a lower low, the preceding candle determines the fair value gap.
The resulting fair value gap is much more accurate than the one we would’ve got otherwise.
Common Mistakes
Using fair value gaps as a standalone strategy: Again, I repeat, using ICT methods standalone is not the best idea. Utilize what you have in your arsenal and develop an edge that lands you decent profits.
Trusting fair value gaps blindly: Fair value gaps are subject to change with time and many other factors that affect the market. Watch out for inversions as well! A single strategy isn’t going to work all the time.
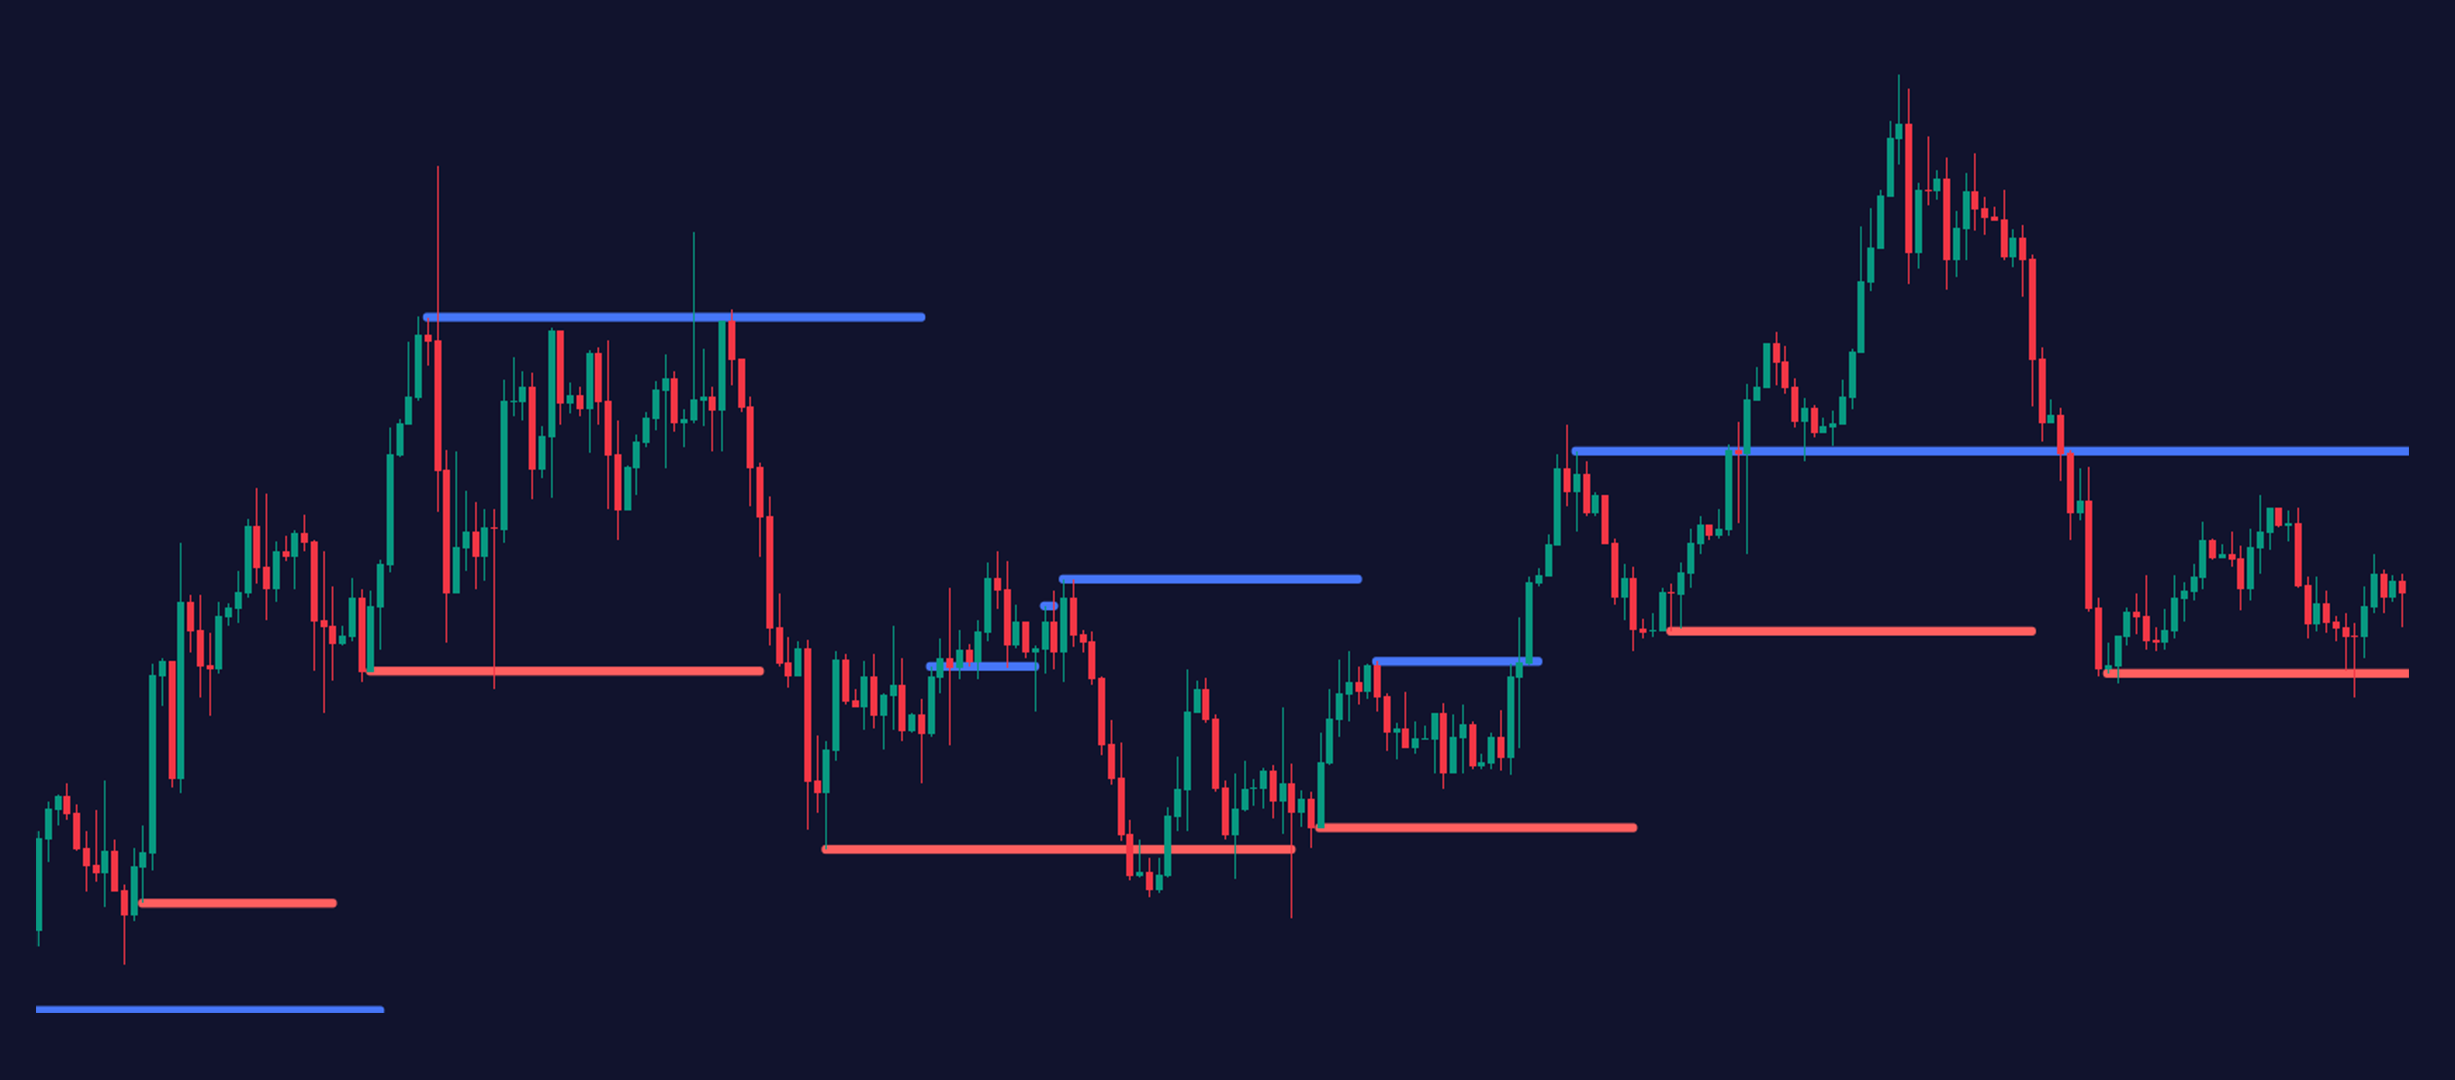
9. Order Blocks
Of the countless concepts in the hundreds of hours of ICT videos, one of the most tried and trusted is the concept of order blocks. This one might be a little overwhelming for beginners, so buckle up.
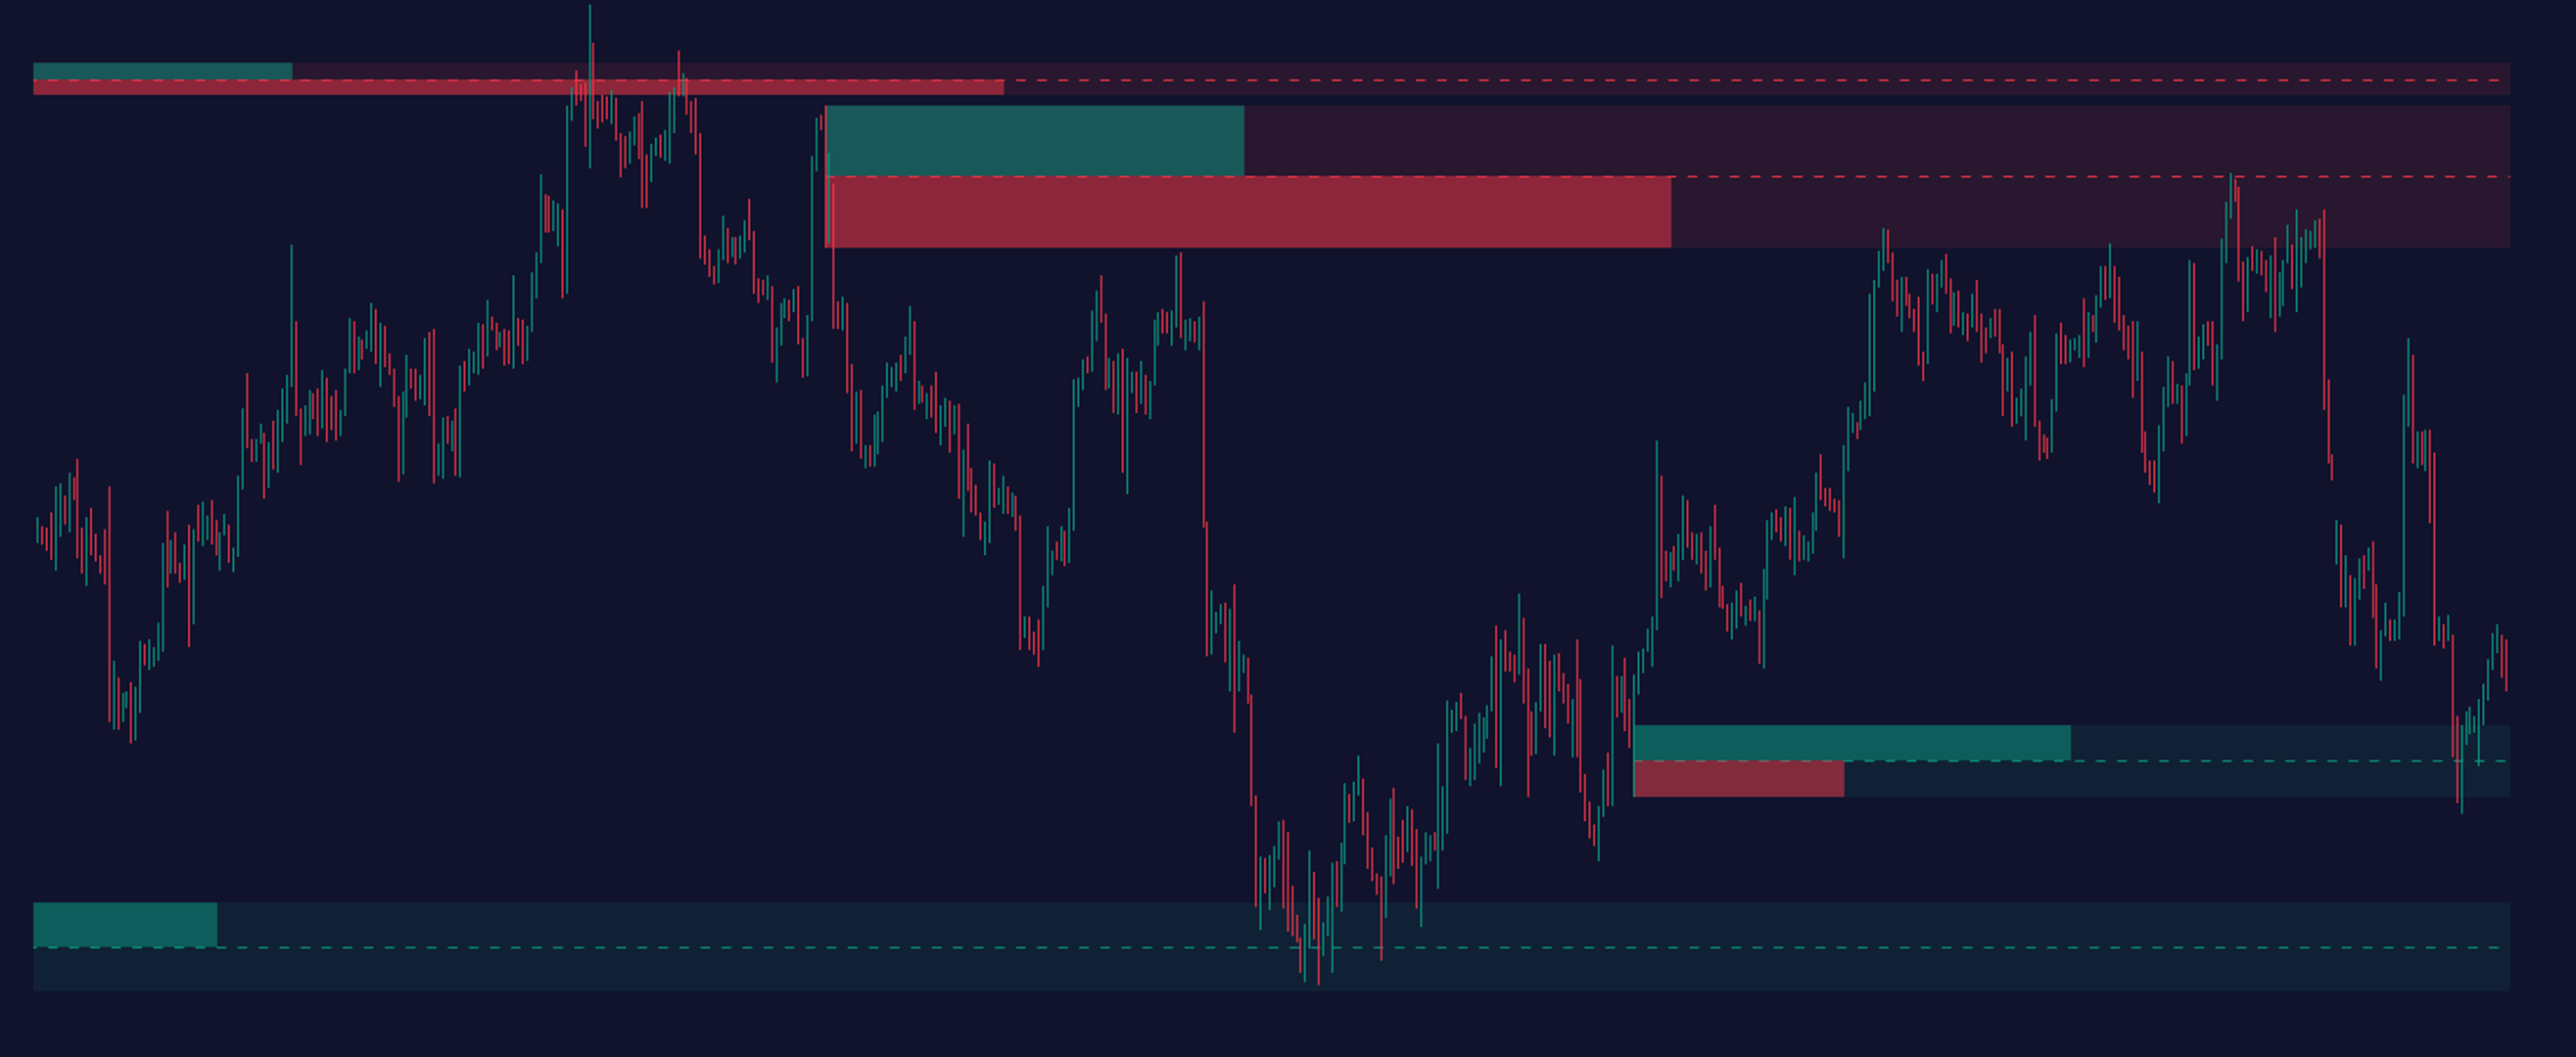
Order Blocks are areas that signify supply and demand. Large-body candles with tiny wicks give rise to high-probability order blocks, while small-body candles with prominent wicks give rise to low-probability order blocks.
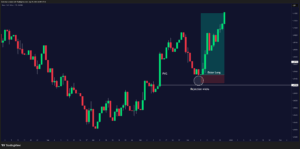
Here’s the situation, a big candle sweeps the sell-side liquidity, and the price action proceeds to break the older high. In this case, the opening of the “big candle” (with a short wick) is where the “Order Block” takes place, and the event it triggers is called “Break of Structure” (BOS).
How to use Order Blocks?
The thing about order blocks is that once price action breaks the structure, it retraces to the Order Block and continues to rise. What we just discussed is the working of the bullish order block.
A bearish order block follows the same principle, albeit with flipped parameters; for instance, we are sweeping the buy-side liquidity with this one instead right before breaking the structure by surpassing the previous low.
Mean Threshold
The mean threshold is 50% (considering the body and not the wicks) of the length of the long-body candle that swept the liquidity. As usual, the price breaks the structure and starts to retrace.
Except this time, it retraces to the order block mean threshold (OB MT) instead of the OB itself. This method is viable only for high-probability order blocks.
What about Low Probability Order Blocks?
A low-probability order block is simpler to spot. What sets it apart is the absence of a fair value gap to the immediate right, as opposed to its high-probability counterparts.
To find a low-probability order block, look for the odd one in a series of long-body, short-wick bullish candles, i.e., a bearish candle with a small body and a prominent wick.
The space between the open and the high of the small body candle is the low probability bullish order block.
For a low-probability bearish order block, look for a bullish candle with a long wick in a group of long-body bearish candles with short wicks. Remember, the area of interest is the order block itself; price action will retrace back to it before going down again.
10. Resources to Learn ICT Concepts
We have a course on Whop that helps you with Introduction to Smart Money Concepts. You can learn about SMC and ICT trading there with actual, real-world applications.
Is ICT profitable?
ICT concepts offer a fresh perspective on trading, drawing inspiration from Richard Wyckoff’s teachings. However, the question of whether these concepts are effective is not easily answered with a simple “yes” or “no.”
These concepts have garnered popularity thanks to their proven track record among many traders. Michael discusses various strategies, with the Silver Bullet Strategy being the most popular. Concepts like ICT kill zones have gained traction within the trading community.
However, it’s worth noting that ICT may not be suitable for everyone, as mastering its concepts is a journey that requires months, if not years, of experience. Crafting strategies that align with one’s trading style also takes time and dedication.
Zeiierman
With over 16 years in the market, Zeiierman has extensive experience as a full-time trader and risk advisory consultant for hedge funds. He has developed many profitable trading strategies, drawing on his background in risk management and strategy execution.
More from Zeiierman