At Zeiierman Trading, we have always been advocates of TradingView. Sure, this article isn’t sponsored, but we have a vested interest in traders properly utilizing all the benefits of TradingView – they host our amazing trading indicators (both free and premium), after all.
TradingView has rapidly become one of the most popular platforms among traders and investors. It is because it offers a powerful suite of market analysis and trading tools.
Alright, ‘nough said. Let’s get started with helping you create a TradingView account and navigate the service.
PSA: This guide is way too long and will likely be the ONLY guide you’ll ever need to get started on tradingview.com. So feel free to skip ahead if there are “steps” you’re already done with.
1. Setting Up Your TradingView Account
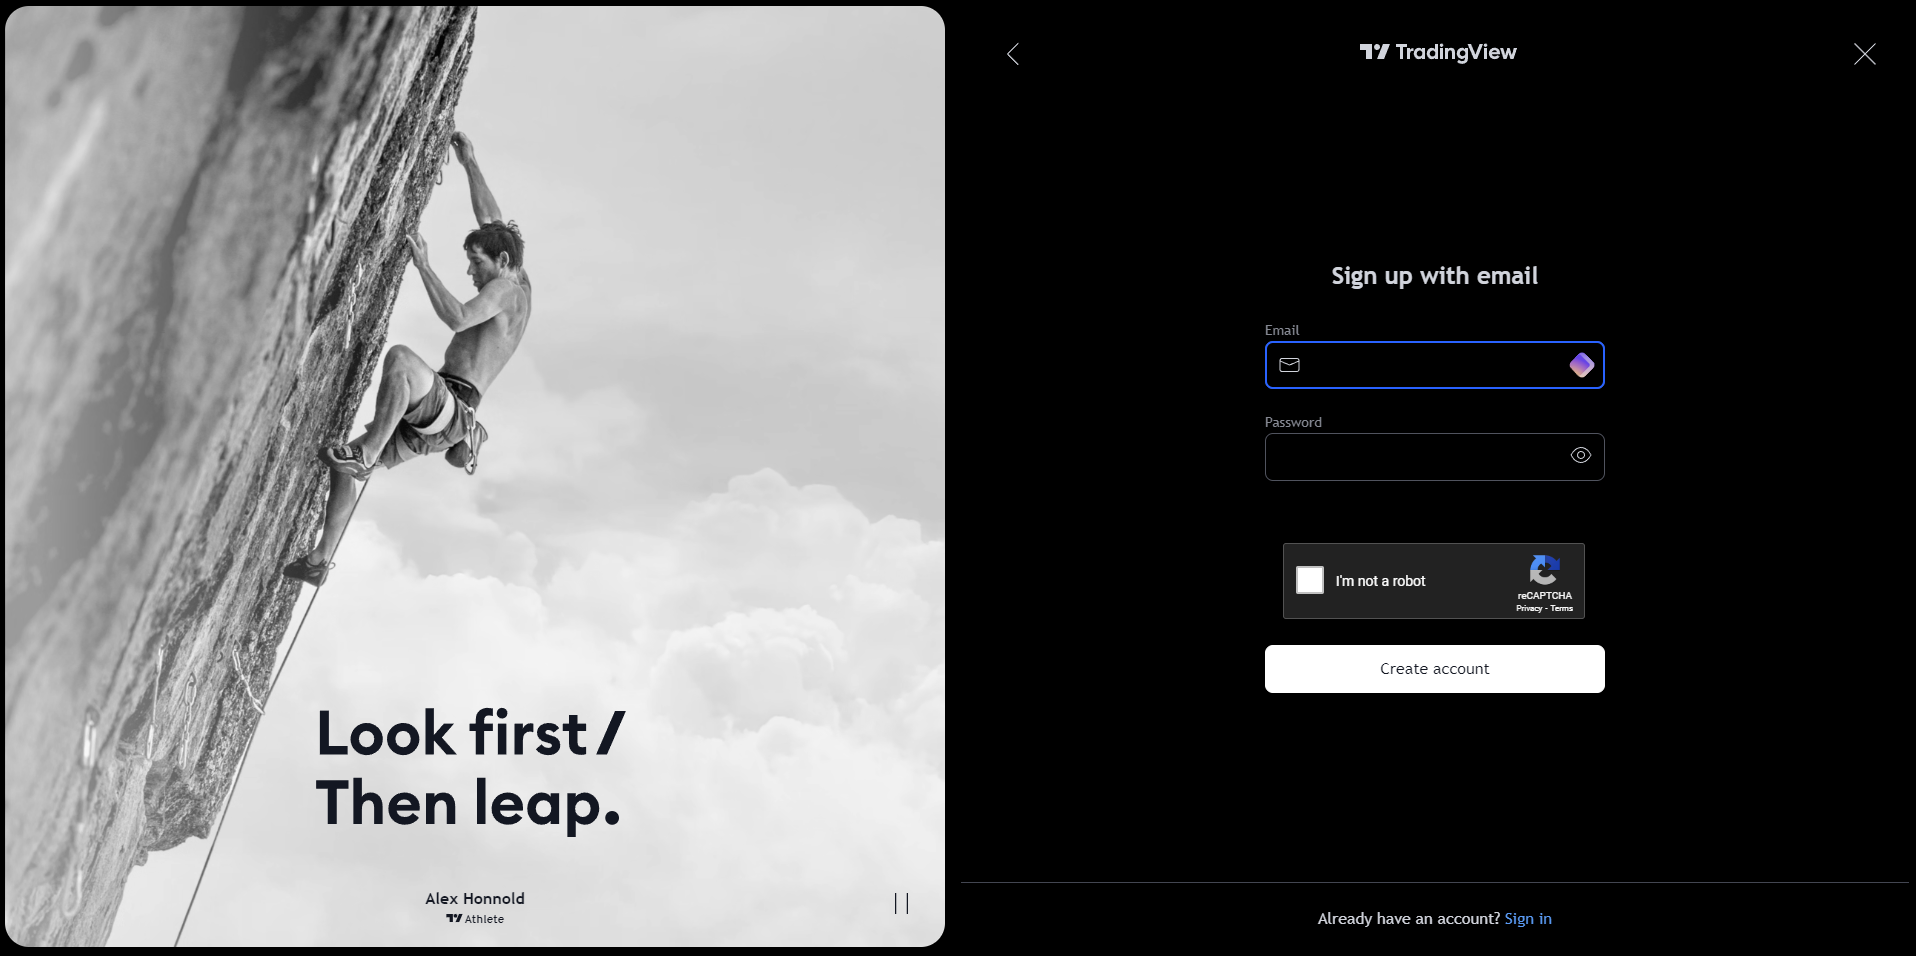
- Click on ‘Get Started’: You’ll see a ‘Get Started’ button on the top-right of the homepage. Click this to begin the sign-up process.
- Choose your sign-up method: TradingView offers multiple options; choose whichever you prefer. Although, a social media account can streamline the process since it auto-fills some of your information.
- Fill in your details: If you choose to sign up with your email, you must provide a valid email address, create a username, and set a password.
- Verify your email: TradingView will send a verification email to your provided address. Click the verification link to activate your account.
- Complete your profile: Once verified, log in to your new account and enter the profile section to complete your details. Adding a profile picture and a brief bio could help you connect with the TradingView community.
1.1 Why is Signing Up Necessary?
While exploring TradingView without signing up is possible, it comes with significant limitations. Here’s why you should sign up:
- Avoid annoying pop-up windows.
- Save your work.
- Accessing critical features like alerts, watchlists, and custom indicators requires an account.
- Access community engagement on tradingview.com.
1.2 How to Customize Your TradingView Profile?
- Profile Picture and Bio: Add a clear PFP (not necessarily your own) and a concise bio. Mention your preferred trading instruments, strategies, and any notable achievements.
- Privacy Settings: Adjust your privacy settings to control what information is visible to others. You can make your profile public or restrict access to your followers only.
- Link Your Social Media: Connecting your social media accounts can make sharing your analyses and ideas easier.
- Follow Other Traders: Follow experienced traders and analysts to get insights and stay updated with market trends. You could always start by following us (Zeiierman).
- Join Public Chats: Participate in public chats related to your trading interests.
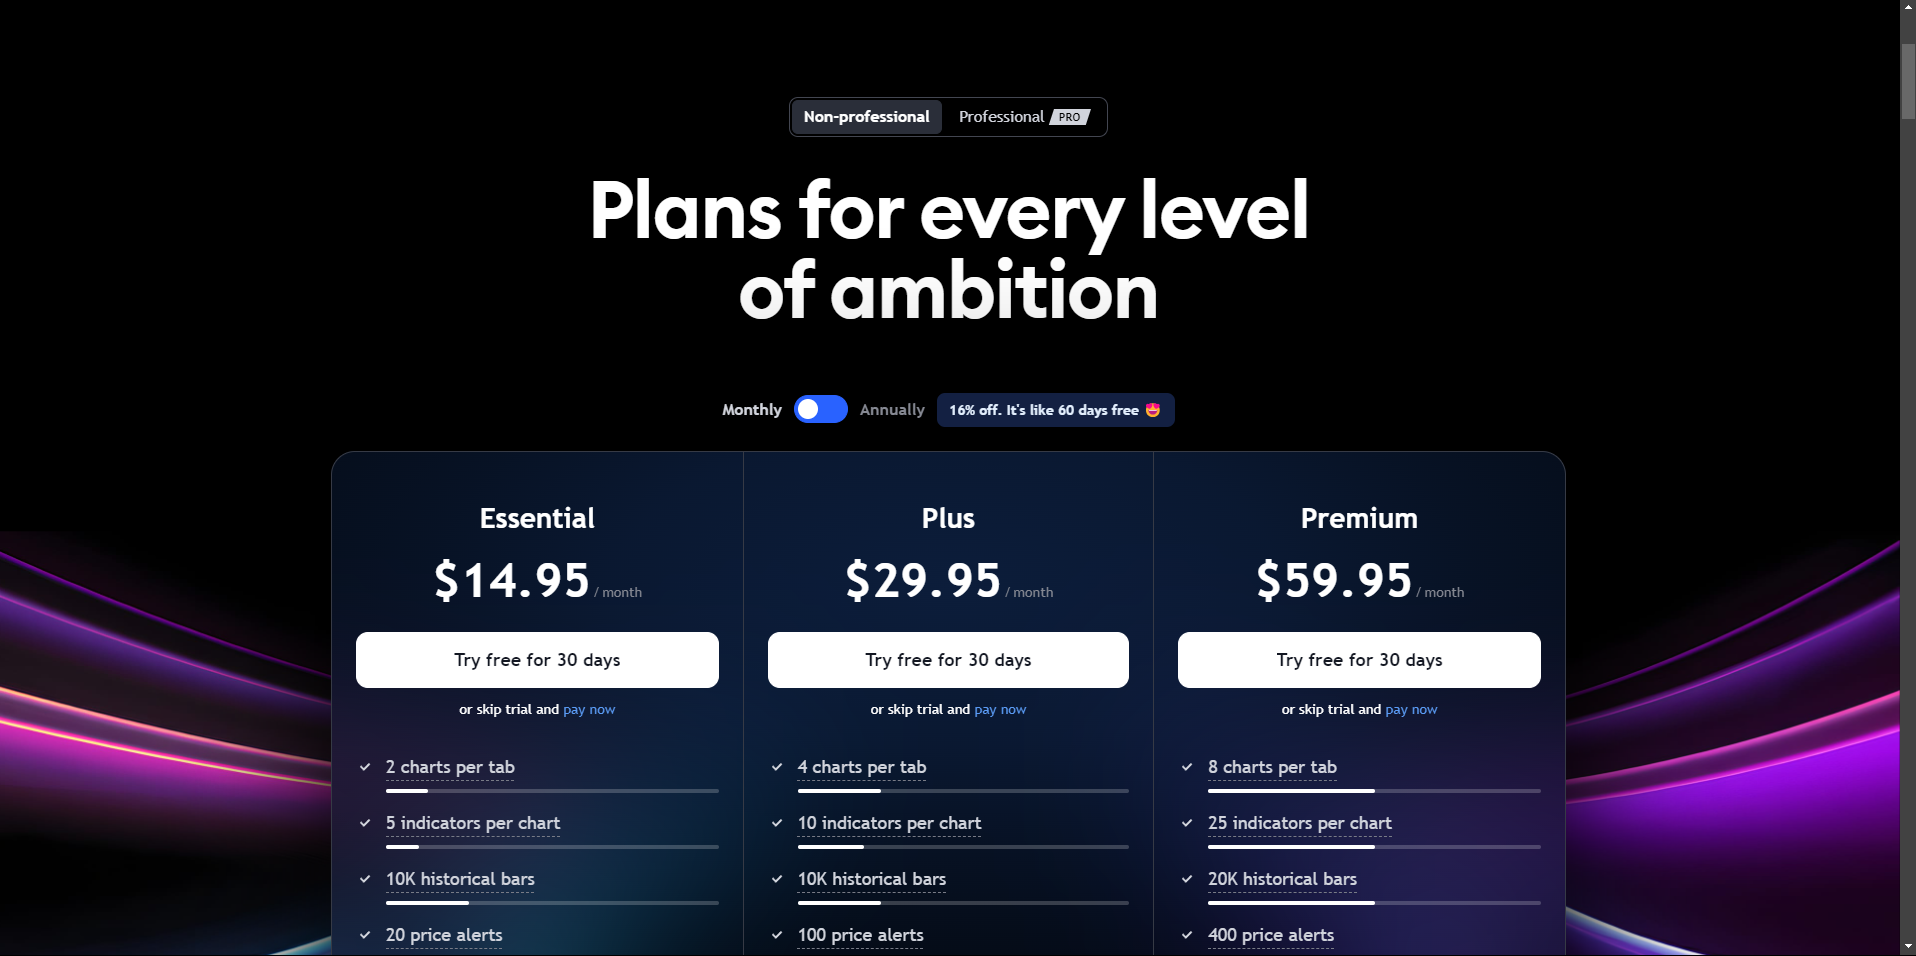
2. Overview of TradingView’s Subscription Plans
Here’s an in-depth comparison of the TradingView pricing models. Although I know it is incredibly hard to comprehend given the massive amount of data. Let me give you the key details:
BASIC Plan (Free)
Best For: Beginners who are just starting out and want to explore TradingView’s capabilities without any financial commitment.
Key Features:
- Limited to one chart per layout.
- Up to three indicators per chart.
- One alert at a time.
- Access to community ideas and public chats.
ESSENTIAL Plan ($14.95/month)
Best For: Traders who need more flexibility and additional features to enhance their analysis.
Key Features:
- Up to two charts per layout.
- Five indicators per chart.
- Ten alerts at a time.
- Ad-free experience.
- Extended trading hours data.
- Custom time intervals.
- Chart data export.
PLUS Plan ($29.95/month)
Best For: Active traders who need advanced tools and multi-monitor setups for comprehensive market analysis.
Key Features:
- Up to four charts per layout.
- Ten indicators per chart.
- 30 alerts at a time.
- Multi-monitor support.
- Intraday exotic charts.
- All features of the ESSENTIAL plan.
PREMIUM Plan ($59.95/month)
Best For: Professional traders and institutions that require the full suite of TradingView’s capabilities for in-depth analysis and strategy development.
Key Features:
- Up to eight charts per layout.
- 25 indicators per chart.
- 400 alerts at a time.
- Second-based intervals.
- Dedicated account manager.
- Priority customer support.
- All features of the PLUS plan.
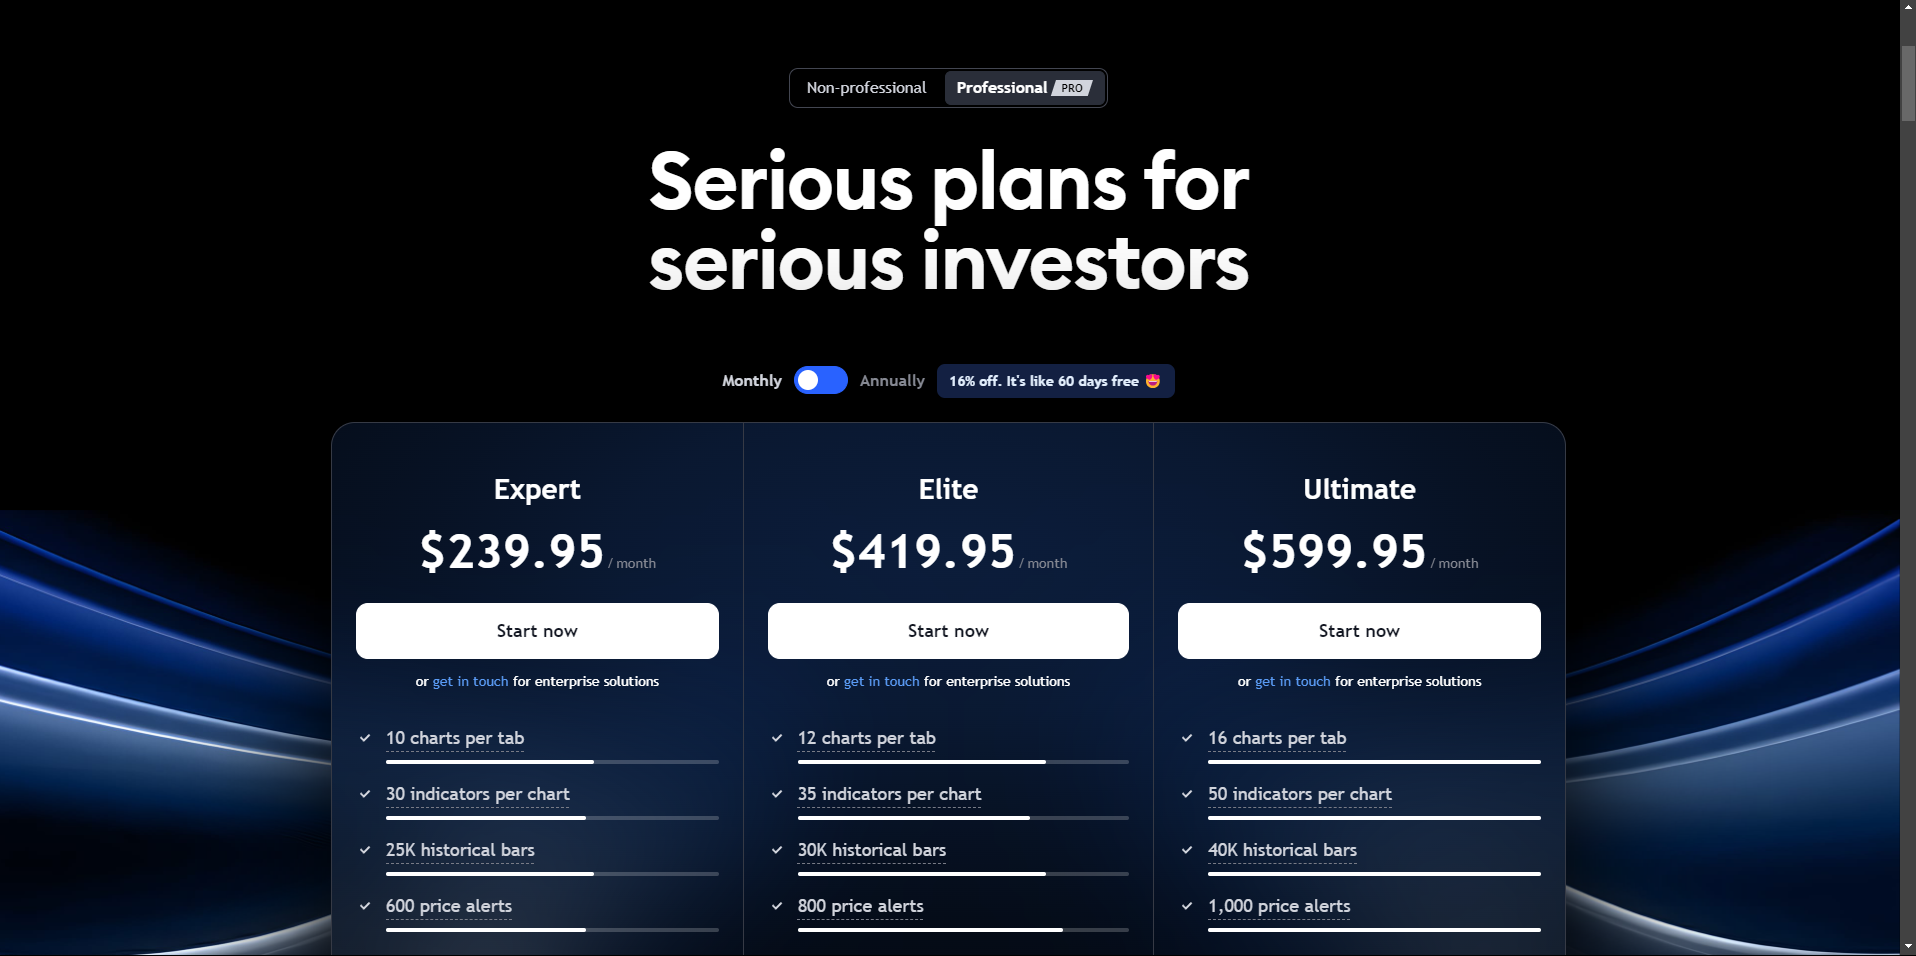
EXPERT Plan ($239.95/month)
Best For: Very active traders needing extensive features and high alert capacities.
Key Features:
- Up to twelve charts per layout.
- 35 indicators per chart.
- 500 alerts at a time.
- All features of the PREMIUM plan.
ELITE Plan ($419.95/month)
Best For: High-frequency traders requiring the highest tier of functionality and support.
Key Features:
- Up to sixteen charts per layout.
- 50 indicators per chart.
- 1000 alerts at a time.
- All features of the EXPERT plan.
ULTIMATE Plan ($599.95/month)
Best For: Institutional traders and financial professionals who need the maximum features and support.
Key Features:
- Up to twenty-four charts per layout.
- 100 indicators per chart.
- 2000 alerts at a time.
- All features of the ELITE plan.
Why is it best to start with a FREE 30-day trial first?
- No Financial Commitment: You can familiarize yourself with the platform’s features and decide if it fits your trading needs correctly.
- Risk-Free Exploration: This is especially useful for traders who want to test advanced tools and indicators.
- Smooth Transition: You can easily transition to a higher-tier plan without losing your saved charts, settings, or analyses.
TradingView’s interface is designed to be intuitive and user-friendly, yet it offers a depth of functionality that can support even the most complex trading strategies.
1. Chart Area
The chart area is where you’ll spend most of your time. It’s the central part of the screen where your selected market’s price data is displayed. You can customize this area to display charts (e.g., candlesticks, bars, lines) and add various indicators and drawing tools.
Zoom In and Out: Use the scroll wheel on your mouse or pinch gestures on a touchpad to zoom in and out of the chart.
If you think how hard it could be to simply zoom in and out, I suggest you think again. Here’s our guide on zooming in and out on TradingView.
2. Toolbar
The toolbar is located on the left side of the interface.
- Drawing Tools: This includes trend lines, support and resistance levels, Fibonacci retracements, and more.
- Indicators and Strategies: Add technical indicators like moving averages, RSI, MACD, and custom scripts from the TradingView community.
- Text and Shapes: Annotate your charts with text, shapes, and icons to highlight key areas and make notes.
3. Side Panels
The side panels on the right side of the interface provide access to additional features and information.
- Watchlist: Keep track of your favorite assets by adding them. You can quickly switch between different markets without searching for them each time.
- Alerts: Set and manage alerts for specific price levels or indicator conditions.
- News and Ideas: Stay updated with the latest market news and trading ideas. This panel also includes economic calendars and earnings reports.
4. Settings
- Chart Settings: Adjust the colors, gridlines, scales, and time zones to match your preferences. You can also configure session breaks and display options for indicators and drawings.
- Account Settings: Manage your profile information, subscription plan, and connected brokers. You can also set up security features like two-factor authentication to protect your account.
Tips for Personalizing the Interface
- Use Keyboard Shortcuts: Familiarize yourself with TradingView’s keyboard shortcuts to speed up your workflow. For example, press “Alt + T” to quickly add a trend line or “Alt + R” to remove all drawings from the chart.
- Create Custom Indicators: If you have coding knowledge, use TradingView’s Pine Script to create custom indicators tailored to your trading strategy.
- Organize Watchlists: Create multiple watchlists for different asset classes or trading strategies. For example, you could have separate watchlists for stocks, cryptocurrencies, and forex pairs.
- Set Up Alerts: Set alerts for key price levels, trendline breaks, or indicator crossovers. Here’s how you set up alerts properly.
- Adjust Timeframes: Customize the available timeframes on your toolbar for quick access.
4. Creating and Customizing Charts
A well-set-up chart can help you make more informed trading decisions and streamline your analysis process.
- Log in to your account: Ensure you are logged into your TradingView account to save your chart layouts and settings.
- Access the chart tab: From the main dashboard, navigate to the “Chart” tab on the left. Clicking on this will open the charting interface.
- Select a market: Use the search bar at the top of the screen to find the market you want to analyze. You can search by the asset’s name or its ticker symbol (e.g., “AAPL” for Apple, “BTCUSD” for Bitcoin).
- Customize your chart layout: Click on the layout icon at the top right of the chart area to save your current layout or switch between different saved layouts.
One of the strengths of TradingView is its versatility in displaying different chart types and timeframes.
4.1 How to customize chart layouts in TradingView?
To change the chart type, click on the chart type icon (usually showing a candlestick) at the top left of the chart area and select your preferred chart type from the dropdown menu.
Here are the chart layouts in TradingView:
- Candlestick Chart: It provides a detailed view of price movements, showing the open, high, low, and close prices within a specified timeframe.
- Bar Chart: Similar to the candlestick chart but with a different visual representation. Each bar shows the open, high, low, and close prices.
- Line Chart: Displays the closing prices connected by a line. It’s simpler and less detailed, often used for long-term analysis.
- Area Chart: Similar to the line chart but with the area below the line filled in, providing a visual sense of volume.
- Heikin Ashi: A variation of the candlestick chart that smooths out price movements to highlight trends more clearly.
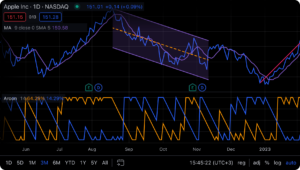
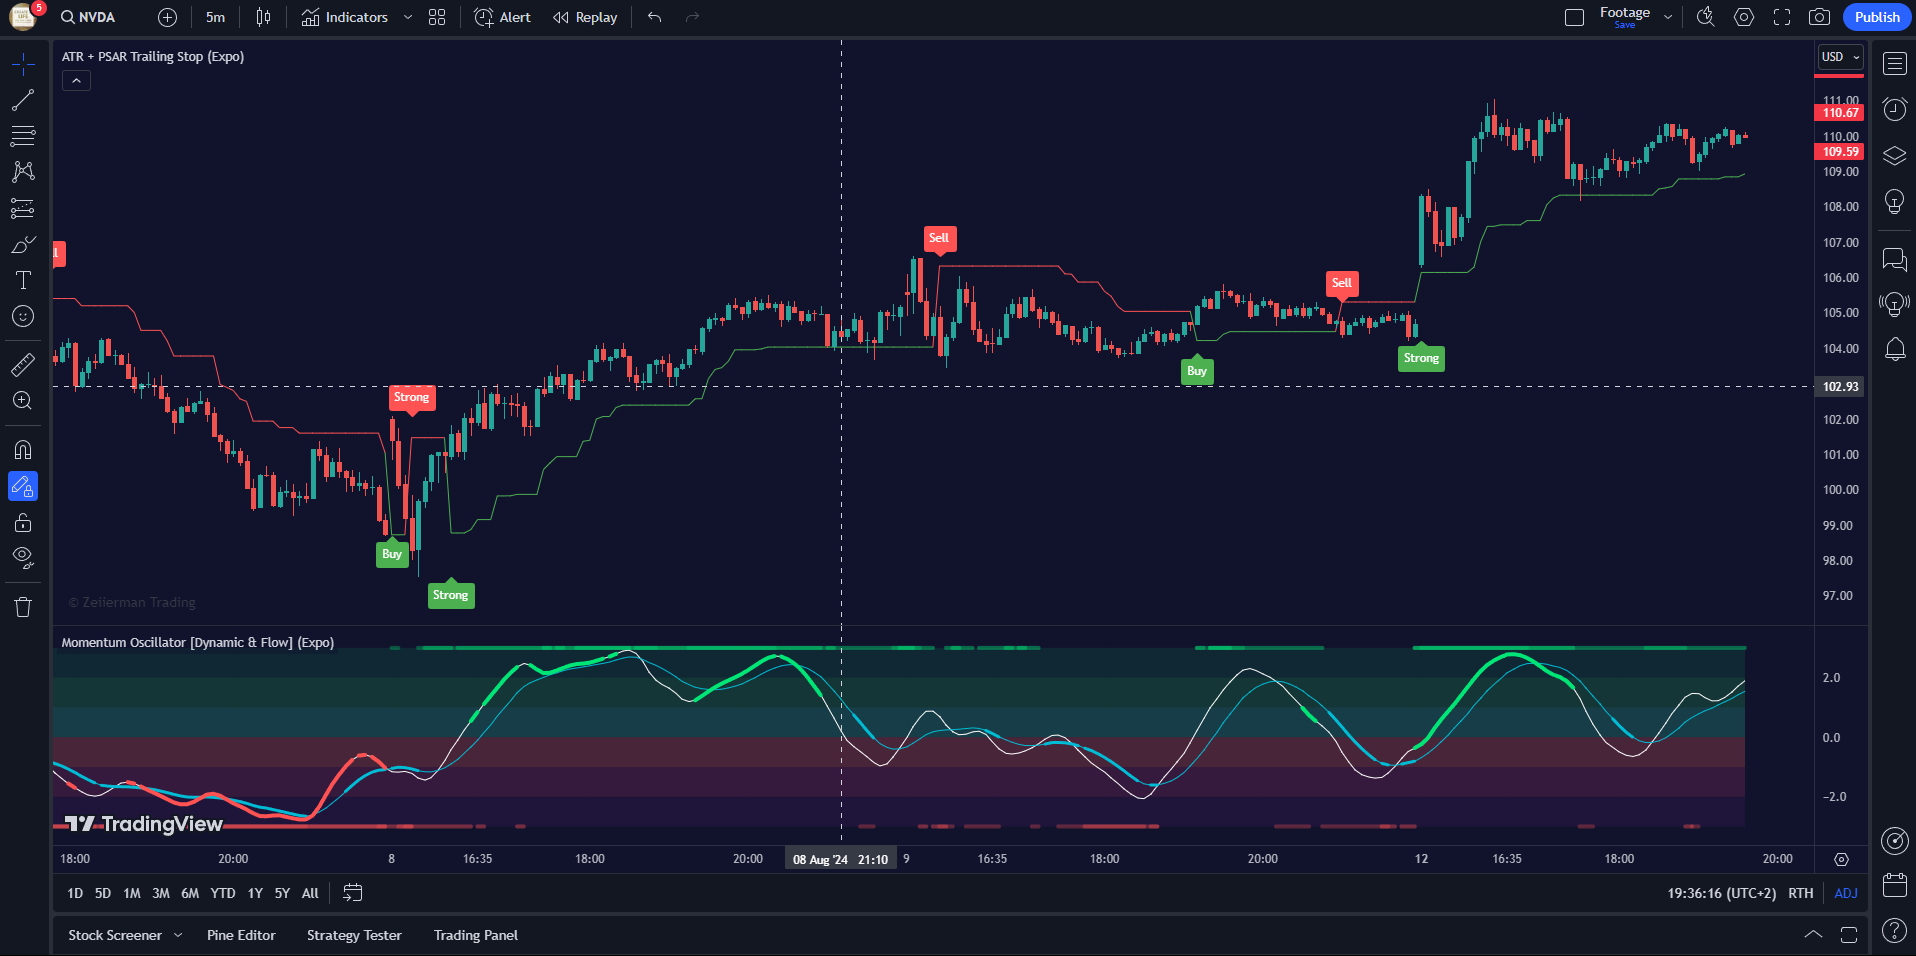
4.2 How to read Candlestick charts?
Candlesticks are the “default” and most commonly used charts among traders. As a beginner you must understand these candlesticks and how to read them.
A. Components of a Candlestick
Body: The thick part of the candlestick shows the opening and closing prices.
A green (or white) body indicates that the closing price was higher than the opening price (bullish), while a red (or black) body indicates that the closing price was lower than the opening price (bearish).
Wicks (Shadows): The thin lines extending above and below the body show the highest and lowest prices during the period.
Color Coding: The color of the candlestick provides a quick visual cue of market sentiment.
B. Read Candlestick Charts in TradingView
Bullish Candlesticks:
- A green candle indicates that the price has increased over the period. The bottom of the body represents the opening price, and the top represents the closing price.
- Long green candles indicate strong buying pressure, while shorter green candles suggest a more moderate increase in price.
Bearish Candlesticks:
- A red candle indicates that the price has decreased over the period. The top of the body represents the opening price, and the bottom represents the closing price.
- Long red candles indicate strong selling pressure, while shorter red candles suggest a more moderate decrease in price.
Doji Candlesticks: A Doji candle has a very small body, indicating that the opening and closing prices were very close. This pattern suggests indecision in the market and could signal a potential reversal.
Hammer and Hanging Man: These candlesticks have small bodies with long lower wicks. A hammer is bullish and typically forms at the end of a downtrend, while a hanging man is bearish and typically forms at the end of an uptrend.
4.3 How to adjust timeframes in TradingView?
To change the timeframe, click the timeframe dropdown menu (next to the chart type icon) and select your desired timeframe. Timeframes can range from seconds to months, letting you tailor the chart to your trading style.
You can also customize the timeframes in this menu for quick access. Day traders might prefer 1-minute or 5-minute charts, while swing traders and long-term investors might opt for daily or weekly charts.
4.5 How to use Drawing Tools for Trend Lines, Support/Resistance Levels, and Annotations
Drawing tools are essential for performing technical analysis. Here’s how to use them effectively:
- Trend Lines: Trend lines identify the direction of the market. To draw a trend line, select the “Trend Line” tool from the toolbar on the left, click on the starting point on the chart, and drag to your desired endpoint. Double-click on the trend line to customize its appearance (color, thickness) and add a label for clarity.
- Support and Resistance Levels:
- These horizontal lines indicate price levels where the market tends to find support as it falls or resistance as it rises. To draw these lines, select the “Horizontal Line” tool from the toolbar, click on the price level you want to mark, and the line will be placed there.
- Use the “Horizontal Ray” tool to extend the line only in one direction to keep your chart clean.
- Fibonacci Retracement:
- It helps you identify potential reversal levels based on the Fibonacci sequence. Select the “Fibonacci Retracement” tool from the toolbar, click on the move’s starting point (either a peak or trough), and drag it to the endpoint.
- Customize the Fibonacci levels to include additional retracement levels that you find useful.
- Text and Annotations: Annotating your charts can help you keep track of your analysis and trading ideas. Use the “Text” tool to add notes or the “Callout” tool to highlight specific points on the chart.
5. Using TradingView for Technical Analysis
Technical analysis involves studying past market data, primarily price and volume, to forecast future price movements.
Unlike fundamental analysis, which looks at economic and financial factors, technical analysis focuses solely on price action and market trends.
5.1 Common Technical Indicators on TradingView
A. Relative Strength Index (RSI):
RSI measures the speed and change of price movements, helping to identify overbought or oversold conditions.
Pro Tip: Look for RSI values above 70 (overbought) or below 30 (oversold) as potential reversal points.
B. Moving Average Convergence Divergence (MACD)
MACD is used to identify changes in the strength, direction, momentum, and duration of a trend.
Pro Tip: Look for MACD line crossovers (above the signal line for bullish and below for bearish) and divergence from the price.
C. Bollinger Bands:
Bollinger Bands measures market volatility and provides a range for price movements.
Pro Tip: Watch for price touches near the upper or lower bands as potential reversal points.
D. Stochastic Oscillator:
This indicator compares a particular closing price to a range of prices over a certain period to identify overbought and oversold conditions.
Pro Tip: Look for Stochastic values above 80 (overbought) or below 20 (oversold) as potential reversal signals.
5.2 Advanced Technical Analysis Using TradingView’s Tools
TradingView offers a range of advanced tools for in-depth technical analysis:
A. Fibonacci Retracement:
Identify potential support and resistance levels based on the Fibonacci sequence. Use Fibonacci levels with other indicators to confirm entry and exit points.
B. Volume Profile
Analyze the distribution of volume over different price levels. High-volume nodes can act as strong support or resistance levels.
C. Trend Lines and Channels:
Draw trend lines to identify the market’s direction and channels to identify potential breakout or breakdown points. Ensure trend lines connect at least two significant points to confirm the trend’s validity.
D. Elliott Wave Theory:
Identify the market’s cyclical nature and predict future price movements based on wave patterns. Combine Elliott Wave analysis with other indicators for a more robust analysis.
5.3 Zeiierman Indicators: Elevate Your Trading Game
Zeiierman Trading offers some of the most advanced and reliable indicators available on TradingView. Our indicators are designed to help you make more informed trading decisions by providing real-time insights and actionable signals.
We believe in empowering traders of all levels. That’s why we offer a range of free indicators you can use immediately.
Our premium indicators provide additional features and advanced functionalities for those looking to take their trading to the next level.
Don’t just take my word for it. Here’s what some of our users have to say:
“The tools from Zeiierman Trading have become an indispensable part of my trading arsenal. Their accuracy and reliability have helped me achieve consistent profits in the market. ✨”
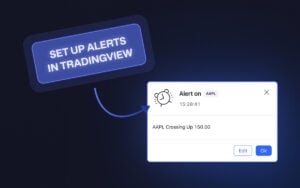
6. Setting Up Alerts and Notifications
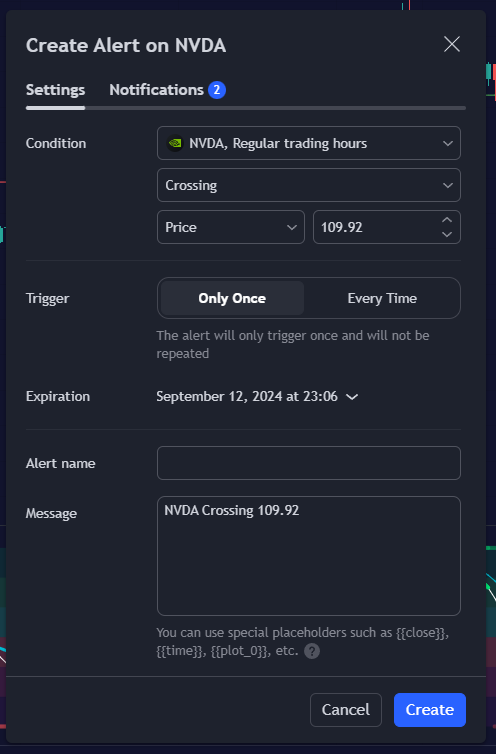
- Access the alerts menu at the top of the chart.
- In the “create alert” window, specify the condition that triggers the alert. For example, you can set the alert to trigger when the price crosses above a certain level.
- Decide how often you want to be notified. Options include “Once,” “Once Per Bar,” or “Once Per Minute.”
- Select how you want to be notified. TradingView offers multiple notification options, including pop-ups, email alerts, SMS alerts, and webhook notifications.
- Review your alert settings and click “create.”
Here’s our detailed guide on creating and customizing alerts on TradingView.
6.1 Ideas for Strategy-based Custom Alerts
Trend Following: Set alerts for trendline breaks or moving average crossovers to catch significant trend changes.
Example: Set an alert for when the 50-day moving average exceeds the 200-day moving average (Golden Cross) to signal a potential uptrend.
Reversal Trading: Use alerts to identify potential reversal points by setting conditions for indicators like RSI or MACD.
Example: Set an alert for when the RSI drops below 30 (oversold) and then crosses back above to signal a potential bullish reversal.
Breakout Trading: Monitor key support and resistance levels by setting alerts for price levels where breakouts are likely.
Example: Set an alert for when the price breaks above a significant resistance level to signal a potential buying opportunity.
7. Social and Community Features
TradingView is not just a charting platform; it’s a vibrant social community where traders and investors share ideas, strategies, and market insights worldwide.
- Idea Streams: TradingView’s idea streams allow users to post their trade setups, market analyses, and insights. These posts often include detailed chart annotations and explanations. You should follow top traders and analysts (including us, haha!) to stay updated on latest ideas and strategies.
- Publishing Your Ideas: Share your own trade setups and analyses with the community by publishing your ideas. Click the “Publish” button on the top right corner of the chart to start.
- Commenting and Interacting: Engage with other users by commenting on their ideas, asking questions, and sharing your thoughts.
8. Paper Trading with TradingView
TradingView’s paper trading platform simulates real-market conditions, helping you refine your skills without risking actual capital.
8.1 What is Paper Trading?
Paper trading, also known as simulated trading, involves practicing trading strategies using virtual money. It mimics real-market conditions, allowing you to test your skills and strategies without financial risk.
8.2 Benefits of Paper Trading:
- Risk-Free Practice: Hone your trading skills without the fear of losing money.
- Strategy Testing: Experiment with different trading strategies to see what works best for you.
- Platform Familiarization: Get comfortable with TradingView’s tools and features in a simulated environment.
- Performance Tracking: Analyze your trades and performance to identify strengths and areas for improvement.
8.3 How to Set Up a Paper Trading Account on TradingView?
- Accessing Paper Trading: Click on the “Trading Panel” tab at the bottom of the chart area. Select “Paper Trading” from the list of available brokers.
- Connecting to Paper Trading: Click the “Connect” button next to “Paper Trading” to link your TradingView account with the paper trading platform.
- Configuring Your Paper Trading Account: Set your starting balance and other account settings. This customization allows you to simulate trading conditions that match your intended real trading environment.
- Placing Trades: Use the chart interface to place buy and sell orders. You can set market orders, limit orders, stop orders, and more, just as you would with a live trading account.
Pro Tip: Keep a trading journal to document your paper trades. I would even go one step further and note the rationale behind each trade and the outcomes. It’ll help you build a coherent trading psychology.
Review your trading performance regularly. Use TradingView’s built-in tools to analyze your trades, calculate profit and loss, and assess your strategy’s effectiveness.
Using TradingView’s paper trading feature, you can develop and test your trading strategies in a safe and controlled environment.
9. Integrating TradingView with Brokers
- Choose a Compatible Broker: Check TradingView’s list of supported brokers to ensure your broker is compatible with the platform. Choose a broker that offers low fees, reliable execution, and good customer support.
- Connecting Your Broker:
- Go to the “Trading Panel” at the bottom of the TradingView interface.
- Select your broker from the list and click “Connect.”
- Follow the on-screen instructions to log in to your broker account and authorize the connection.
- Configuring Your Trading Settings: Once connected, configure your trading settings, such as order types, position sizes, and risk management parameters.
- Placing Trades Through TradingView: Use the TradingView interface to place buy and sell orders directly with your broker. Monitor your positions and manage trades using TradingView’s advanced charting tools and indicators.
- Managing and Reviewing Trades: Access your trade history and performance metrics through the TradingView platform.
10. Risk Management and Trading Strategies
Effective risk management is crucial for long-term trading success. I recommend setting rules and guidelines to minimize losses and protect your capital.
Without proper risk management, even the best trading strategies can fail.
10.1 Setting Stop-Loss and Take-Profit Levels
Stop-loss levels help limit losses by automatically closing a trade at a predetermined price. Take-profit levels lock in your profits by closing a trade when it reaches a specified price.
Pro Tip: Use ATR (Average True Range) to set dynamic stop-loss and take-profit levels based on market volatility.
10.2 Position Sizing Strategies:
Determine the size of each trade based on your risk tolerance and account size. Common methods include a fixed dollar amount, percentage of account balance, and volatility-based sizing.
Pro Tip: Never risk more than 1-2% of your trading capital on a single trade. Do note that there’s a difference between a reasonable investment and a “risky trade.”
10.3 Basic Trading Strategies for Beginners
- Trend Following: Identify the direction of the market trend and trade in the same direction. Use indicators like moving averages and trend lines to confirm the trend. Enter trades at pullbacks within the trend for better entry prices.
- Swing Trading: Capture short to medium-term price movements by entering trades at market swings. Use support and resistance levels and oscillators like RSI and MACD to identify entry and exit points.
Pro Tip: Combine swing trading with trend analysis to improve accuracy.
10.3 Advanced Trading Strategies
- Breakout Trading: Enter trades when the price breaks through significant support or resistance levels. Use volume indicators to confirm the strength of the breakout.
- Mean Reversion: Trade is based on the assumption that prices will revert to their mean or average over time. Use Bollinger Bands, moving averages, and stochastic oscillators to identify overbought and oversold conditions.
- Algorithmic Trading: Develop and implement automated trading strategies using TradingView’s Pine Script language. Test and optimize your algorithms through backtesting and paper trading.
Zeiierman
With over 15 years in the market, Zeiierman has extensive experience as a full-time trader and risk advisory consultant for hedge funds. He has developed many profitable trading strategies, drawing on his background in risk management and strategy execution.
More from Zeiierman