The Head and Shoulders is, without a doubt, one of the most recognized price action structures in technical analysis. But there’s an issue: while most traders know the pattern, very few trade it right.
Let’s fix that today. If you’re unsure about the basics, please understand the pattern theory first by using our beginner resources. This article will solely focusing on strategies and practical tips of trading this pattern properly.
Zeiierman and I are often asked in our community about the longevity and relevance of some of these old patterns. Do they still work or has the market gotten more complex?
The Head & Shoulders pattern still works well in 2025 —but only when you know how to recognize valid vs. fake setups, factor in volume and liquidity, and combine it with modern tools like Smart Money Concepts or our own Zeiierman indicators.
Note: There’s also a “gift” in the end. We made a Head & Shoulders Pattern script (indicator) for our TradingView community.
Advanced Strategies to Trade Head & Shoulders Patterns
1. Volume Matters More Than You Think
Volume is the lie detector of any price pattern—including the Head and Shoulders. While classic theory often mentions “declining volume during formation” and “rising volume on the breakout,” most traders gloss over it.
How volume should behave in a valid pattern:
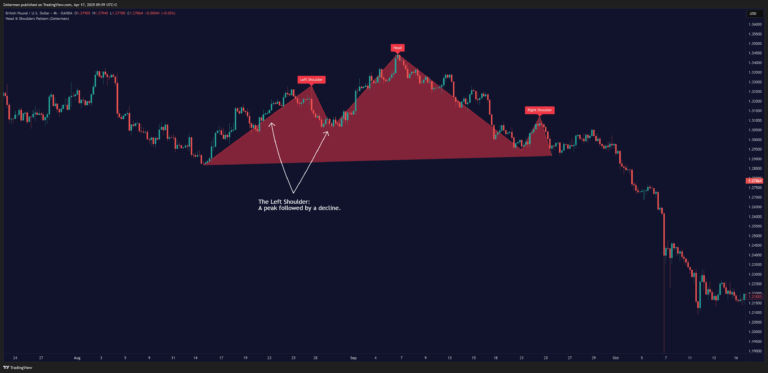
- Left Shoulder: Volume starts high
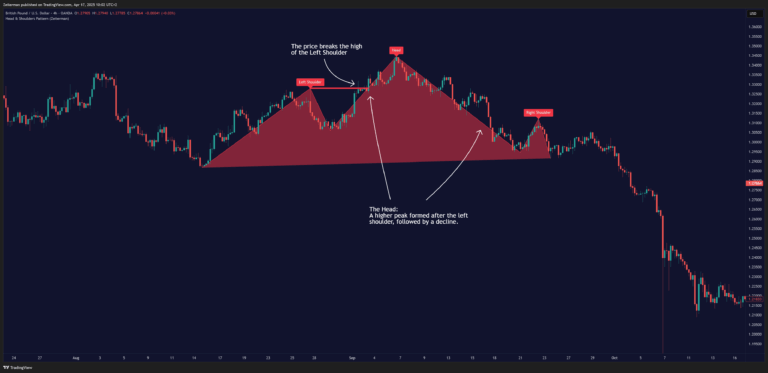
- Head: Volume may increase, especially if it’s a stop-hunt or emotional breakout
- Right Shoulder: Volume fades—momentum is weakening
- Neckline Break: Volume must spike. If not, you likely have a trap.
Here’s how I read volume context to make trading decisions:
Low Volume Breakouts = High Fakeout Risk
If the neckline break happens on weak volume, it usually means there’s no institutional support. These often reverse quickly and stop out early breakout traders.
Volume Spikes at the Head = Early Warning
If you see massive volume on the head, it could signal a stop-hunt or exhaustion. That adds more conviction if the right shoulder forms cleanly afterward.
Confirmation with Retest + Volume Surge
If the price breaks the neckline, pulls back, and volume picks up on the retest bounce, that’s your high-probability entry zone.
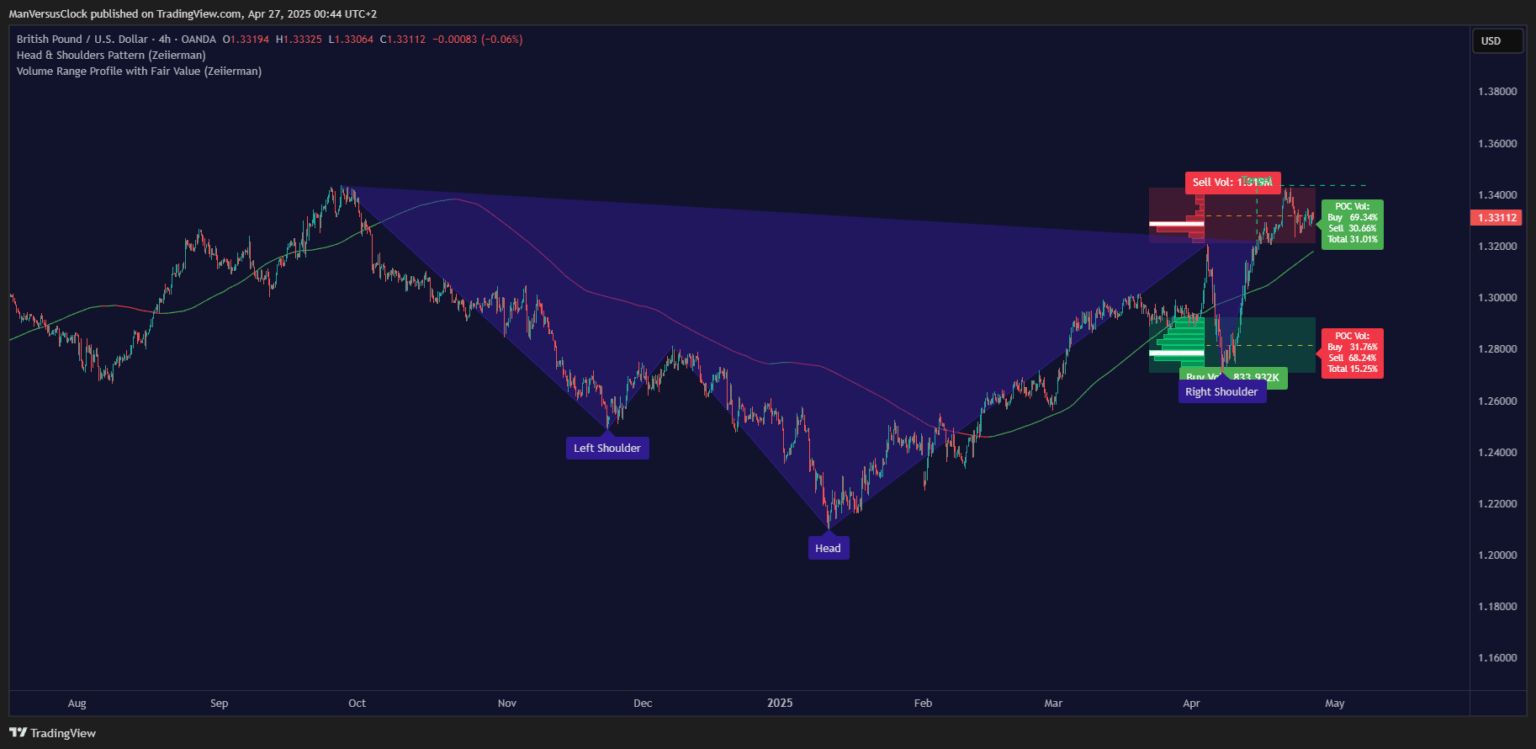
Here are the two indicators we deploy when trading volume: On-Balance Volume Flow and Price & Volume Profile. We often pair the Zeiierman Reversal Algo with OBV. If both show directional conviction, we increase size. If they diverge—we sit out.
2. Tactics for Volatile Markets
In volatile markets, patterns don’t behave as textbooks say. Necklines break early. Right shoulders deform. And breakouts become liquidity traps.
As such, our approach needs to evolve too. In fact, I recently did an extensive article on trading in volatile / wild markets. In the article, I mentioned the four crucial strategies we have developed specifically for volatile markets after years of testing. Let’s get back to H&S now.
How Volatility Affects the Pattern:
- Necklines break prematurely as price wicks hard through zones
- Measured moves over- or underperform based on sentiment bursts
- Breakouts are often stop hunts, not setups
Example:

Pro Tip: Sometimes, the Head and Shoulders are a trap in itself. A failed H&S (especially after neckline break + quick reversal) often turns into a continuation setup.
Here’s how you adjust stops and targets:
- Stops: Widen them based on ATR or structure. Use smaller size if necessary
- Targets: Partial profits at nearby levels. Don’t get greedy in volatility
- Entries: Scale in on retests, not on emotional spikes
📈 Tip: On BTC/USD, we often place stops at least 1.5x the recent ATR to avoid getting wicked out.
3. Use Smart Money Concepts to Validate Patterns
Retail sees patterns. Smart money sees liquidity.
The Head and Shoulders pattern is one of the most easily spotted formations in technical analysis. But because it’s easy to spot, it’s also easy to manipulate. That’s why we apply Smart Money Concepts (SMC) to validate whether a setup is real—or bait. I am “SM_Trader,” after all.
Access our Free SMC Indicator on TradingView or the Premium SMC Indicator for advanced trades. In SMC terms, a Head and Shoulders is often a liquidity sweep before the real move begins.
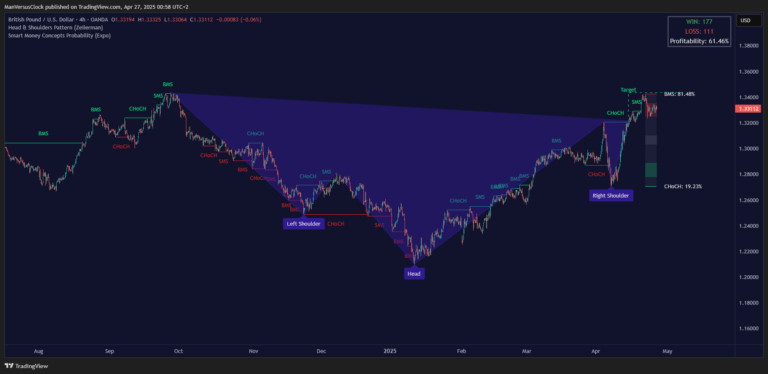
The head is where stop-losses get taken out. The right shoulder is where supply or demand begins to shift. The neckline becomes the true structural line.
So, how do you confirm? We use CHoCH or BOS as confirmation tools.
- A CHoCH (Change of Character) near the right shoulder or neckline can signal a shift in market intent.
- A Break of Structure (BOS) that lines up with the neckline gives even stronger confirmation.
SMC Rule: I have a simple rule-based on SMC concepts. If the price breaks the neckline AND prints a CHoCH (or BOS) on the lower timeframe, this is potentially a high-probability trade.
Once you get confirmation, you don’t need to enter blindly. Look for a bullish/bearish Order Block near the neckline for re-entry. Imbalance zones (gaps left in price action) often get filled before continuation.
How to trade Head and Shoulders pattern?
Suppose you have recognized the pattern, the neckline is drawn, and now waiting for the break. What’s next, making the trade?
To properly and effectively trade the Head & Shoulders pattern, I follow a time-tested strategy:
- Wait for pattern confirmation, don’t anticipate;
- Plan your entry: breakout or retest; and
- Use the right shoulder for stops unless volatility demands more.
Let me explain.
Step 1: Wait for Pattern Completion
Before anything else, wait for the pattern to complete. Don’t jump the gun.
- Partial or nearly completed patterns can and do fail.
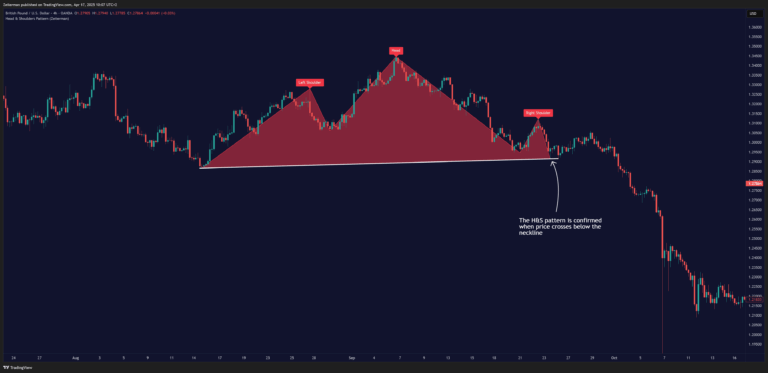
- The trade becomes valid only after the price breaks below the neckline in an H&S Top or above an Inverse H&S.
Do not fall for FOMO, and avoid entering too early.
Step 2: Plan Your Entry
There are two primary ways to enter:
- Breakout Entry (Aggressive): Enter when the neckline breaks with volume. This gives early Entry but may expose you to false breakouts.
- Retest Entry (Conservative): Wait for the price to pull back and retest the neckline after the breakout. If the price respects the neckline and resumes the breakout direction, that’s your confirmation.
Pro Tip: This retest method reduces false signals but may result in missing the move if the market doesn’t pull back. Write both scenarios in your trading plan.
If you have been following this article well, you know there’s a third way to enter: SMC-Validated Entry.
- Look for CHoCH or BOS structure aligning with the neckline break.
- Confirm with a breaker block or mitigation zone.
- Enter on imbalance fill or OB rejection.
If you’re using our Reversal Algo on TradingView, you’ll often see this align right at the neckline retest.
Step 3: Placing Your Stop-Loss
There are two general approaches here:
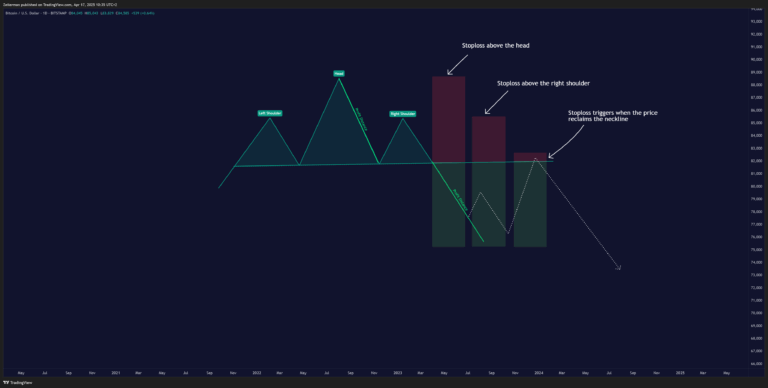
Preferred: Right Shoulder Stop
Stop above the right shoulder for the Head & Shoulders top.
Stop below the right shoulder for inverse Head & Shoulders top.
This approach offers balanced risk and high probability.
Alternate: Head-Based Stop
Placing the stop above/below the head offers maximum protection but increases risk and reduces R:R.
Use this approach only if the structure supports wider volatility and your size is reduced.
My Golden Rule: Use the right shoulder for stops unless volatility requires a deeper cushion.
Step 4: Setting Targets
To set realistic targets, measure the height from the head to the neckline:
- For Head & Shoulders Top, subtract this from the neckline breakout price.
- For Inverse Head & Shoulders, add this to the neckline breakout price.
Example:
- Head Low = $101.13
- Neckline/Breakout = $113.25
- Distance = $12.07
- Target = $113.25 + $12.07 = $125.32
That’s your textbook target. That said, markets seldom move in straight lines. So, we tend to divide targets into multiple steps. Here’s an example setup:
- Target 1: 50% of the projection
- Target 2: Full measured move
- Target 3: Major structure or HTF level
Step 5: Monitor and Adjust
Sometimes, trades take time to play out. Be prepared to hold for days or weeks—especially on higher timeframes. Let the trade breathe and adjust stops only if the structure changes, not based on fear.
How to act when the pattern is confirmed?
At this point, we’re no longer “anticipating.” It is our call to decide whether it’s a trade worth taking.
If it’s a Head and Shoulders Top (Bearish Reversal):
You’re typically dealing with a market that has failed to make a new high and is starting to show weakness.
If the breakout is accompanied by volume, that’s your green light to act.
Two things you can do:
- Exit long positions to protect profit or prevent further losses.
- Enter short positions, expecting a move down to your projected target.
Target calculation: Measure the distance from the top of the head to the neckline. Then, project that same distance downward from the breakout point.
For example, if the head peaks at $1000 and the neckline is around $960, your measured target is $920. That becomes your first logical take-profit zone.
If it’s a Head and Shoulders Bottom (Inverse – Bullish Reversal):
Again, volume on the breakout is key. If the breakout happens with conviction, there are two things to consider:
- Enter long positions expecting continuation to the upside.
- Set targets by measuring the depth of the pattern (lowest point of the head to neckline), then projecting it upward.
Example: Head bottom at $1520. Neckline at $1560. Target = $1600.
That said, I do have a crucial tip from my experience. Don’t just trade the break; wait for the retest. Often, the price will break the neckline, then come back to retest it.
This is where the best trades usually happen—when the breakout is tested, held, and confirmed.
Why do most traders get the H&S pattern wrong?
As I said before, everyone learns the Head and Shoulders pattern. Very few actually trade it well. I compiled the message requests we had gotten over the years in our Zeiierman Discord community, and here’s where most traders go wrong:
1. They Trade Ideas, Not Confirmations
They try to predict the pattern before it’s confirmed. You see a left shoulder and a head forming and assume the right shoulder will follow.
Let me tell you that sometimes, it doesn’t follow. Or it stretches into something else entirely—like a channel or triangle.
2. They Misplace the Neckline
This is a big one. Many traders force a horizontal neckline even when the structure clearly calls for a diagonal. That throws off everything—your entry, stop, and target.
What pros do: Draw the neckline based on the lowest point between the shoulders (for H&S Top) or the highest point between the shoulders (for Inverse H&S).
Use wick-to-wick logic or body-to-body, depending on volatility. And yes, sometimes the neckline slopes.
3. They Ignore Volume
Volume is the pattern’s lie detector.
A clean neckline break with no volume? Likely a trap.
Volume declining as the pattern forms? That’s structure.
Volume spiking at the break? That’s intent.
🛠 Our team often uses the Zeiierman Reversal Algo combined with volume profile to spot breakouts that actually hold. If both confirm, it’s a green light.
4. They Fall for Symmetry Bias
Markets don’t care about aesthetics. Not all shoulders are equal. Not all necklines are flat. Some H&S setups are compressed inside ranges, and some are extended across weeks. They still work.
5. They Don’t Combine the Pattern With Market Context
A Head and Shoulders pattern forming against a higher timeframe trend or during low liquidity is a red flag.
What pros do: Zoom out. Align with the HTF bias. The Head and Shoulders pattern will probably form right below a major resistance zone with clean exhaustion and volume divergence.
6. They Don’t Use Tools That Can Help Them
Most retail traders rely only on their eyes. But visual confirmation isn’t enough in today’s algorithmic market.
What pros do: They layer in tools like Zeiierman Reversal Algo, SMC overlays, or basic liquidity heatmaps.
FAQs of Head & Shoulders Trading Pattern
1. What is the success rate of the Head and Shoulders pattern?
As the famous saying goes, it works all the time for 60% of the time. The success rate of the Head and Shoulders pattern (or any indicator) depends on how it’s traded. Blindly trading every H&S pattern without proper context or confirmation often leads to failure.
2. Is the Head and Shoulders pattern reliable in 2025?
The Head and Shoulders pattern is still reliable in 2025—if you use it correctly. We combine the H&S structure with volume analysis, Smart Money Concepts, and contextual tools like trend direction or liquidity zones.
3. Does the Head and Shoulders pattern work in crypto?
The Head and Shoulders pattern works well in crypto but has more volatility and fakeouts than traditional markets. Because crypto is prone to thin liquidity and aggressive wicks, confirmation is crucial.
That said, there’s a clear way to stay away from fakeouts. And we already taught it to you.
Always watch for volume, neckline structure, and retests before entering. Tools like Reversal Algo or order block overlays will help you filter out low-probability setups.
4. What timeframe is best for trading the Head and Shoulders pattern?
The best timeframes for trading the Head and Shoulders pattern are the 15-minute and 1-hour charts for short-term setups and the 4-hour and daily charts for swing trades.
From my experience, 1 hour strongly balances signal clarity and trade frequency.
Bonus: Zeiierman’s Head & Shoulders Indicator
Our Head & Shoulders Pattern indicator on TradingView doesn’t just draw a neckline and call it a day. We use advanced pattern recognition to scan price action for symmetry, pivot structure, and neckline integrity in real time.
Whether you’re looking for classic reversals or subtle formations within trends and ranges, the indicator adjusts dynamically to spot both major and minor setups.
It marks the left shoulder, head, and right shoulder on your chart, and even projects potential targets from the neckline break — all while letting you customize the sensitivity and visual display.
Think of it as a structure clarity tool. One that shows you not just where the pattern is, but how to trade it more confidently.
SM_Trader
SM_Trader is a highly experienced coder and strategy developer who brings the most complex algorithms to life. As a member of MENSA, the prestigious organization for individuals with intelligence scores in the top 2% of the world, he combines exceptional analytical skills with a keen eye for numbers and statistics, empowering businesses to grow at the right pace and in the right direction.
More from SM_Trader