Our Buy/Sell Indicators
We at Zeiierman Trading have developed 9 different advanced Buy/Sell signals indicators. The reason why we provide 9 Buy/Sell signals indicators is that they identify different market behaviors.
Key Features
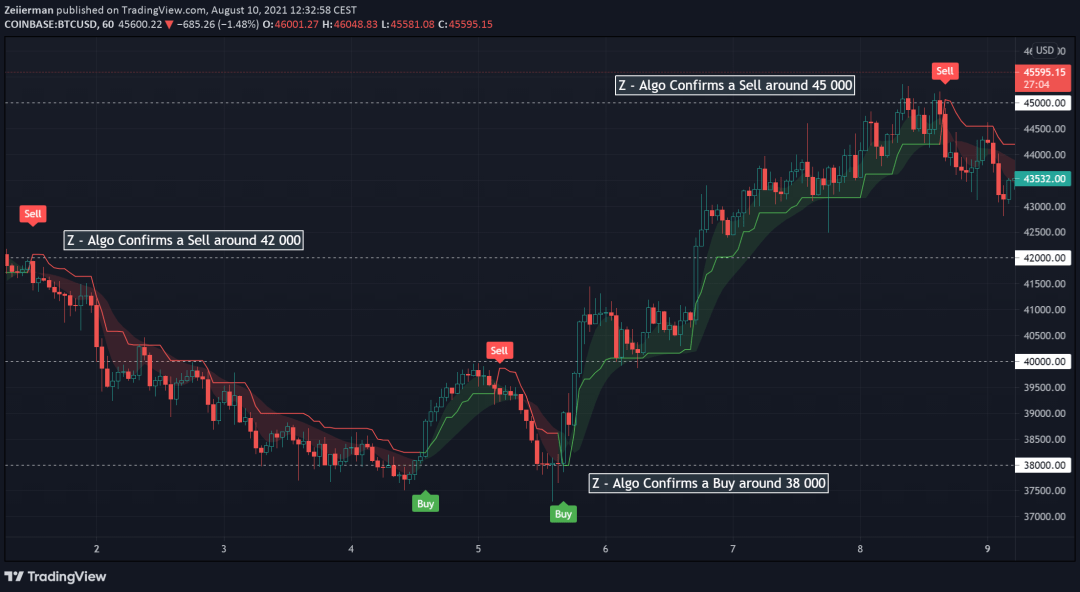
All our Buy/Sell signals have their own key feature which should be the base in the strategy you come up with. For instance, if you’re looking for Buy/Sell signals at the best times, no matter which trend we are in you should use Z -Algo. If you want to look for reversals, you can use Reversal Algo.
Read more about the key features below. Click on the boxes to get to the script!
Let’s talk about how to use these indicators
All Buy/Sell signals are great and useful if you understand how to use them correctly. None of the signals are predicting the price action, they just indicate that something interesting is about to happen. This is a key difference and important to understand. If the indicators were designed to predict the market it would have made sense to follow them blindly.
However, it’s hard to make sophisticated prediction models with limited data and within Tradingview. That is why all these indicators are built upon the recent historical data and rely upon the current price action to give insights about what may happen to the future price action. They just indicate that something happens to the current price action, for instance, that the bullish structure is about to shift to bearish. This is still useful insight for Traders. This kind of head-up is invaluable! If you as a trader get insights about, for instance, that a potential reversal is coming, you can easily prepare yourself for that scenario.
When we know that something is about to happen, we as a trader can start preparing ourselves for that scenario. For instance, if the Trend Algo indicates a long, we start to look for confirmation and confluence that support that idea. We do not enter blindly on the signals, rather use the signal to confirm that the market is about to change direction. Use the signals as an extra confirmation.
It’s all about using these indicators as confirmation. If you understand this simple idea you gonna be able to use them successfully.
3 aspects to keep in mind
- Strategy: To use any of these indicators successfully you have to use them with your base strategy. If you have a base strategy you can easily use the indicators to confirm and find extra confirmation to enter a trade. Super Simple and yet effective.
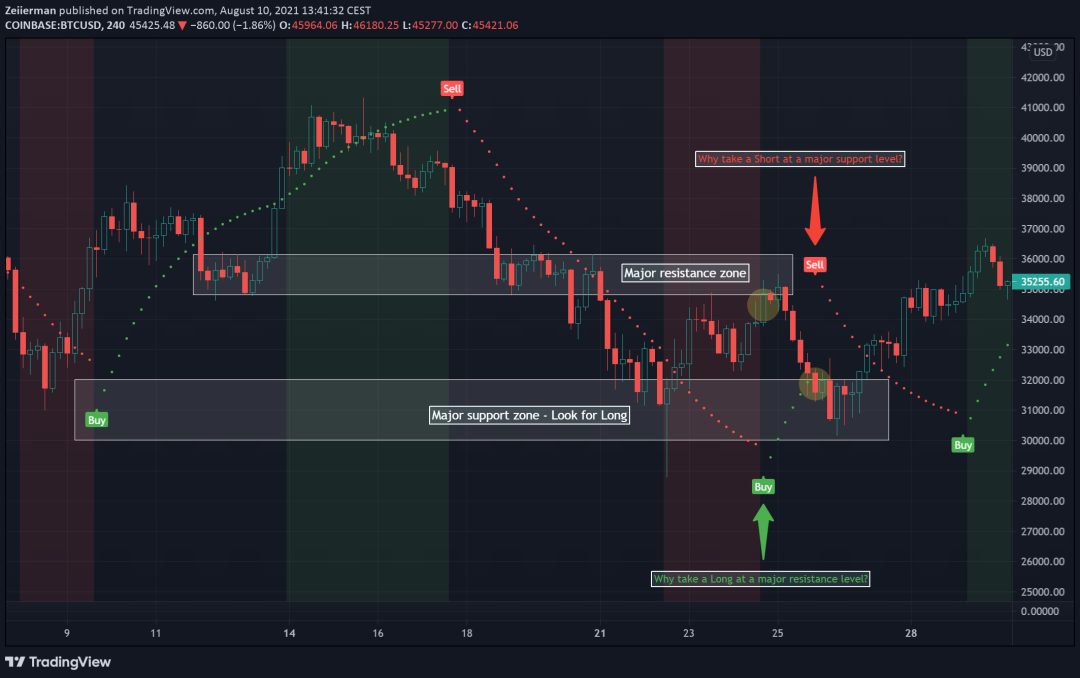
- Support/Resistance: In order for you to be a successful trader, you have to have a basic understanding of Support/Resistance. You have to understand that you should not take any long trades at a resistance level and should not take any short trades at a support level.
- Confirmation: You should not follow any of these signals blindly, you should use them as Confirmation to support your base strategy or trade idea/scenario. Once you start doing that, you gonna be able to trade successfully.
Indicators are built to indicate something, they do not predict or confirm anything itself. What I mean is that indicators are not built to be followed blindly.
Often, indicators indicate a change in the current price structure which may lead to a new structure in the near future. That is immensely valuable information for Traders, we get heads up about potential future price structure, bullish/bearish.
So to clarify things, a Buy/Sell signal on the chart does not mean that the price will make a significant move in that direction directly. It’s not like that we gonna get a 100 pips move within the next 10 candles… We just get the information that price structure can change in the near future and we have to start to look for confirmation/confluence that supports that idea.
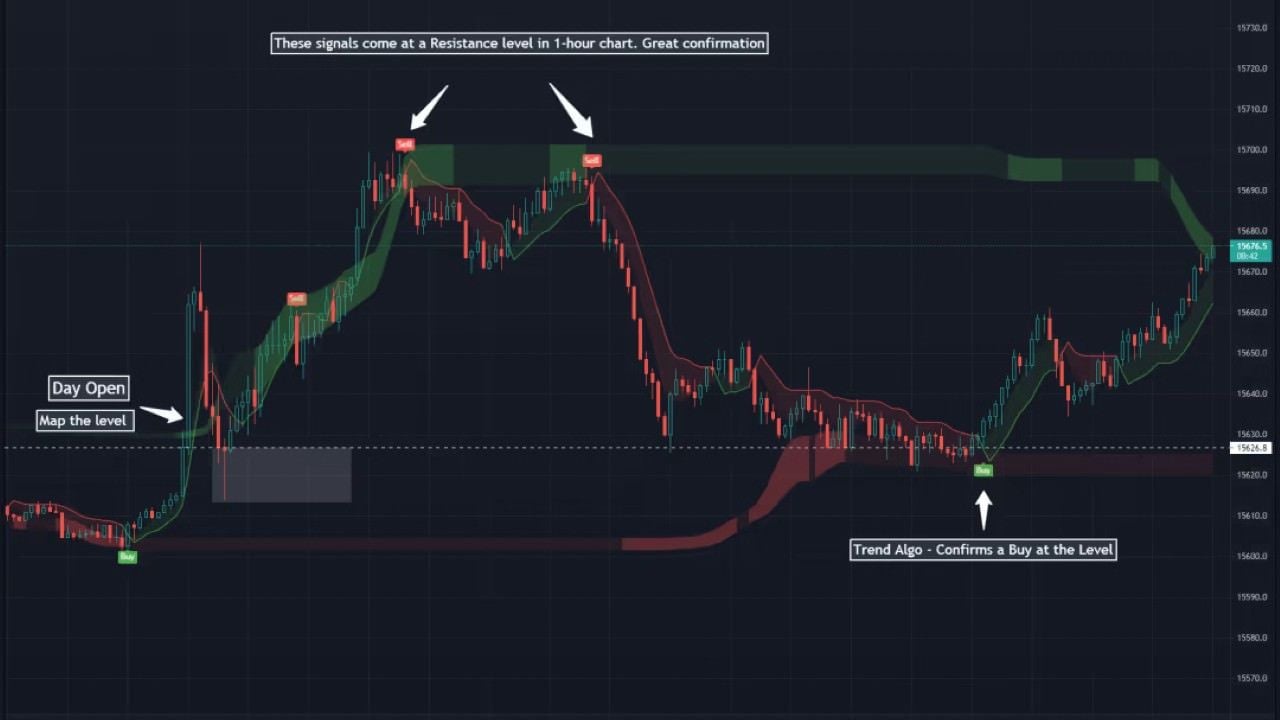
Have a look at the example below: German 30 – 1 min chart
1) Using Day Open as a level (price will most likely respect or do something around day open (consistent pattern))
2) Using a simple resistance level derived from the 1-hour chart.
3) Using Trend Algo to confirm that price structure may change around the levels. Which is a good confirmation that supports the idea that the levels are respected and the price will most likely react in some way.
Why not having a backtest?
The indicators do not have a backtest?
The user has to backtest themself in accordance with their base strategy. No point in following any Buy/Sell signal indicator blindly. If you want to find a Buy/Sell indicator that you can follow blindly, where you can take every signal without having a base strategy, you won’t find one. What we have realized during these years is that traders that understand that indicators are used to confirm/find confluence with your own strategy are the ones that are successful in our group. Traders that 100 % want to rely on an indicator won’t find success in our group.
Then what is the point of having buy and sell signals? Take Range and Trend for example. Seems like a great indicator. Depicts the trend, has the BUY and SELL indications which can be set up as signals. But why is that? If you are saying that the indicators are not built for backtesting how can you prove they actually work?
> Our tools are built to be used together with your existing strategies and setups. To confirm/enhance trading setups and strategies and not to be followed blindly. Indicators are used to indicate that something may happen at certain points and if it coincides with other methods it can support your trade idea and you feel more confident in taking your trade.
Range & Trend is indicating potential trend shifts and hence can help us understand if we should look for Long or Short trades within that trend. So to sum up, the indicators help us understand what may happen in the market. Confirm what an indicator is indicating with other methods/indicators and with your experience. It’s all about finding that extra confirmation that often is the missing piece that takes a good trading setup to a very profitable one.
How to avoid false signals
No indicator out there can be 100 % accurate all the time. They all produce false signals. That is why we have to have a clear strategy and not follow any signal blindly. It’s again all about finding that extra confirmation.
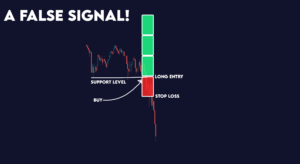
The number #1 reason why false signals occur is that the signals were fired at support or resistance levels!! Check it yourself.
- A short signal at a support level = be careful.
- A long signal at a resistance level = be careful.
Confirm if we potentially gonna get a Breakout or a Reversal at these levels.
You can therefore increase your edge tremendously if you pay extra attention to what happens around support/resistance levels.
Example using Trend & Contrarian
First of all, these signals (Buy/Sell) is giving us a heads-up that the market structure might change towards Bullish or Bearish. The background color indicates that a trend is confirmed. If a trend is confirmed we want to find a support/resistance level to enter our trades at.
Keep it simple:
- In a Bullish Trend, we want to enter long at support levels and look for bullish breakouts.
- In a Bearish Trend, we want to enter short at resistance levels and look for bearish breakouts.
In the graph below we show a Bullish breakout from the 32K level. We have also pointed towards how the Buy signal is fired at a support level (around 38K), and how price takes off from that point.

Find What Works For You
Give it a spin!
We encourage everyone to play around with our indicators and tools in order for you to understand how it works and find what fits your trading style. Since we all are different we all need different tools and strategies.
