One would assume you wouldn’t need a guide for something as simple as zooming in and out. Alas, life isn’t that simple and TradingView’s documentation is quite terrible.
That said, once you do get the hang out if, they’ve really thought it out well. TradingView’s interface is designed to be intuitive, making it accessible for traders of all levels.
You can zoom in and out of charts using your mouse wheel, you can also zoom into a certain part of the chart by using the COMMAND key (in Mac) or CTRL key (in Windows). You can also zoom into the prices and expand the chart by scrolling over the right panel where the prices are written.
Option+R (in Mac) or Alt+R (in Windows) will reset the chart in case you zoomed in or out too much.
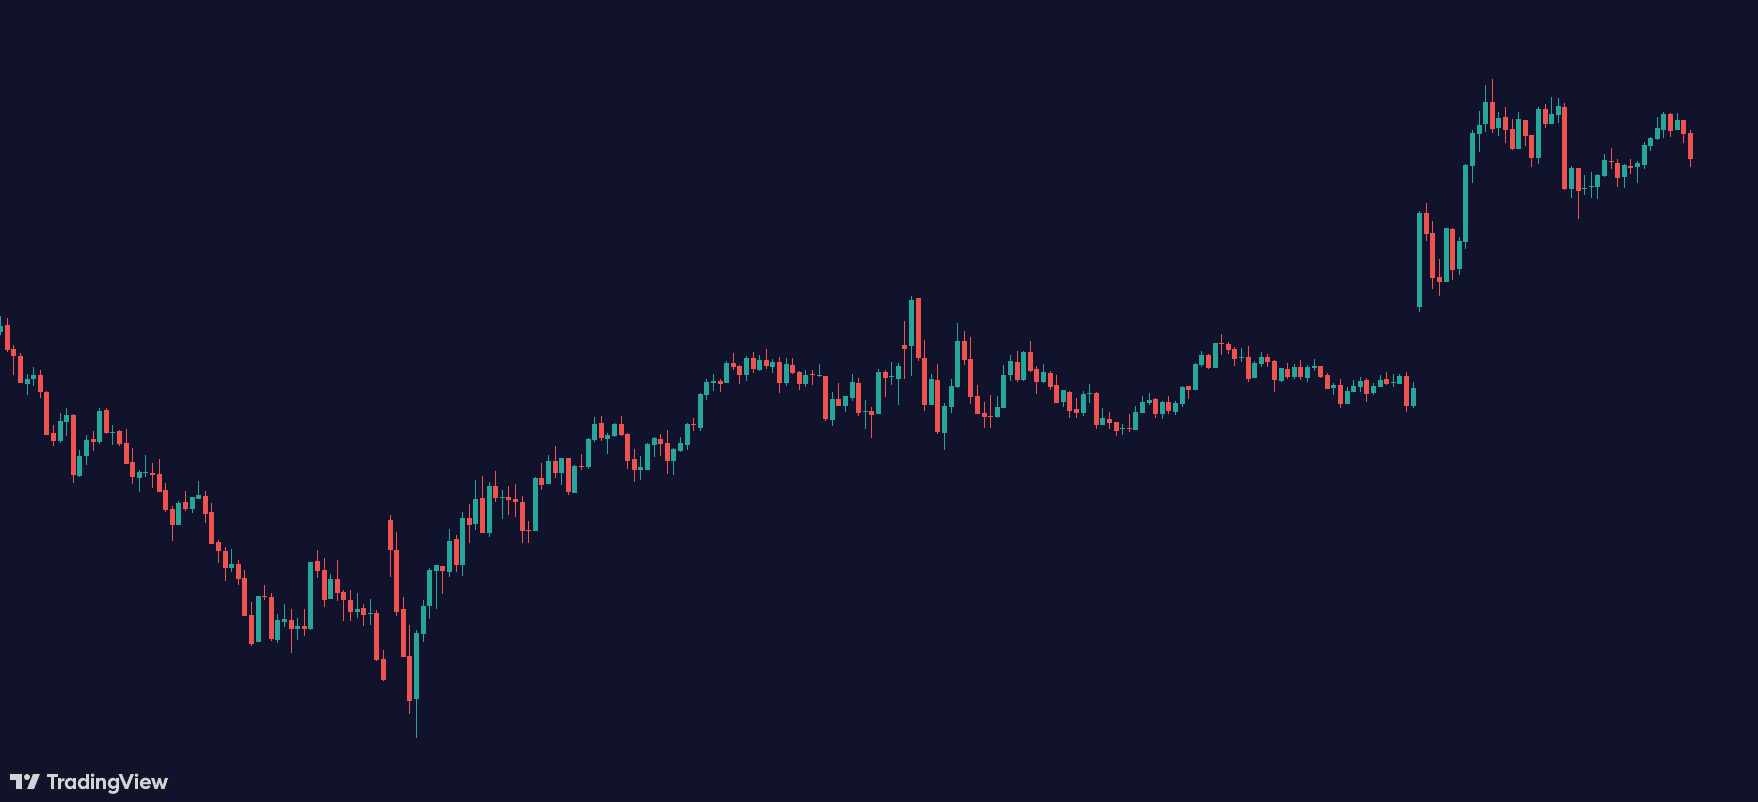
Key Components of TradingView Charts
Chart Area: The chart area is where all the action happens. This is where you can view price movements, draw trend lines, add indicators, and zoom in and out to analyze different timeframes.
Toolbar: The toolbar provides quick access to various tools and features, including zoom functions. You’ll find buttons for zooming in and out, as well as other useful tools like drawing and measurement tools.
Panels: On the sides of the chart, you have panels for managing watchlists, adding indicators, and accessing other settings. These panels can be customized to suit your trading style and preferences.
