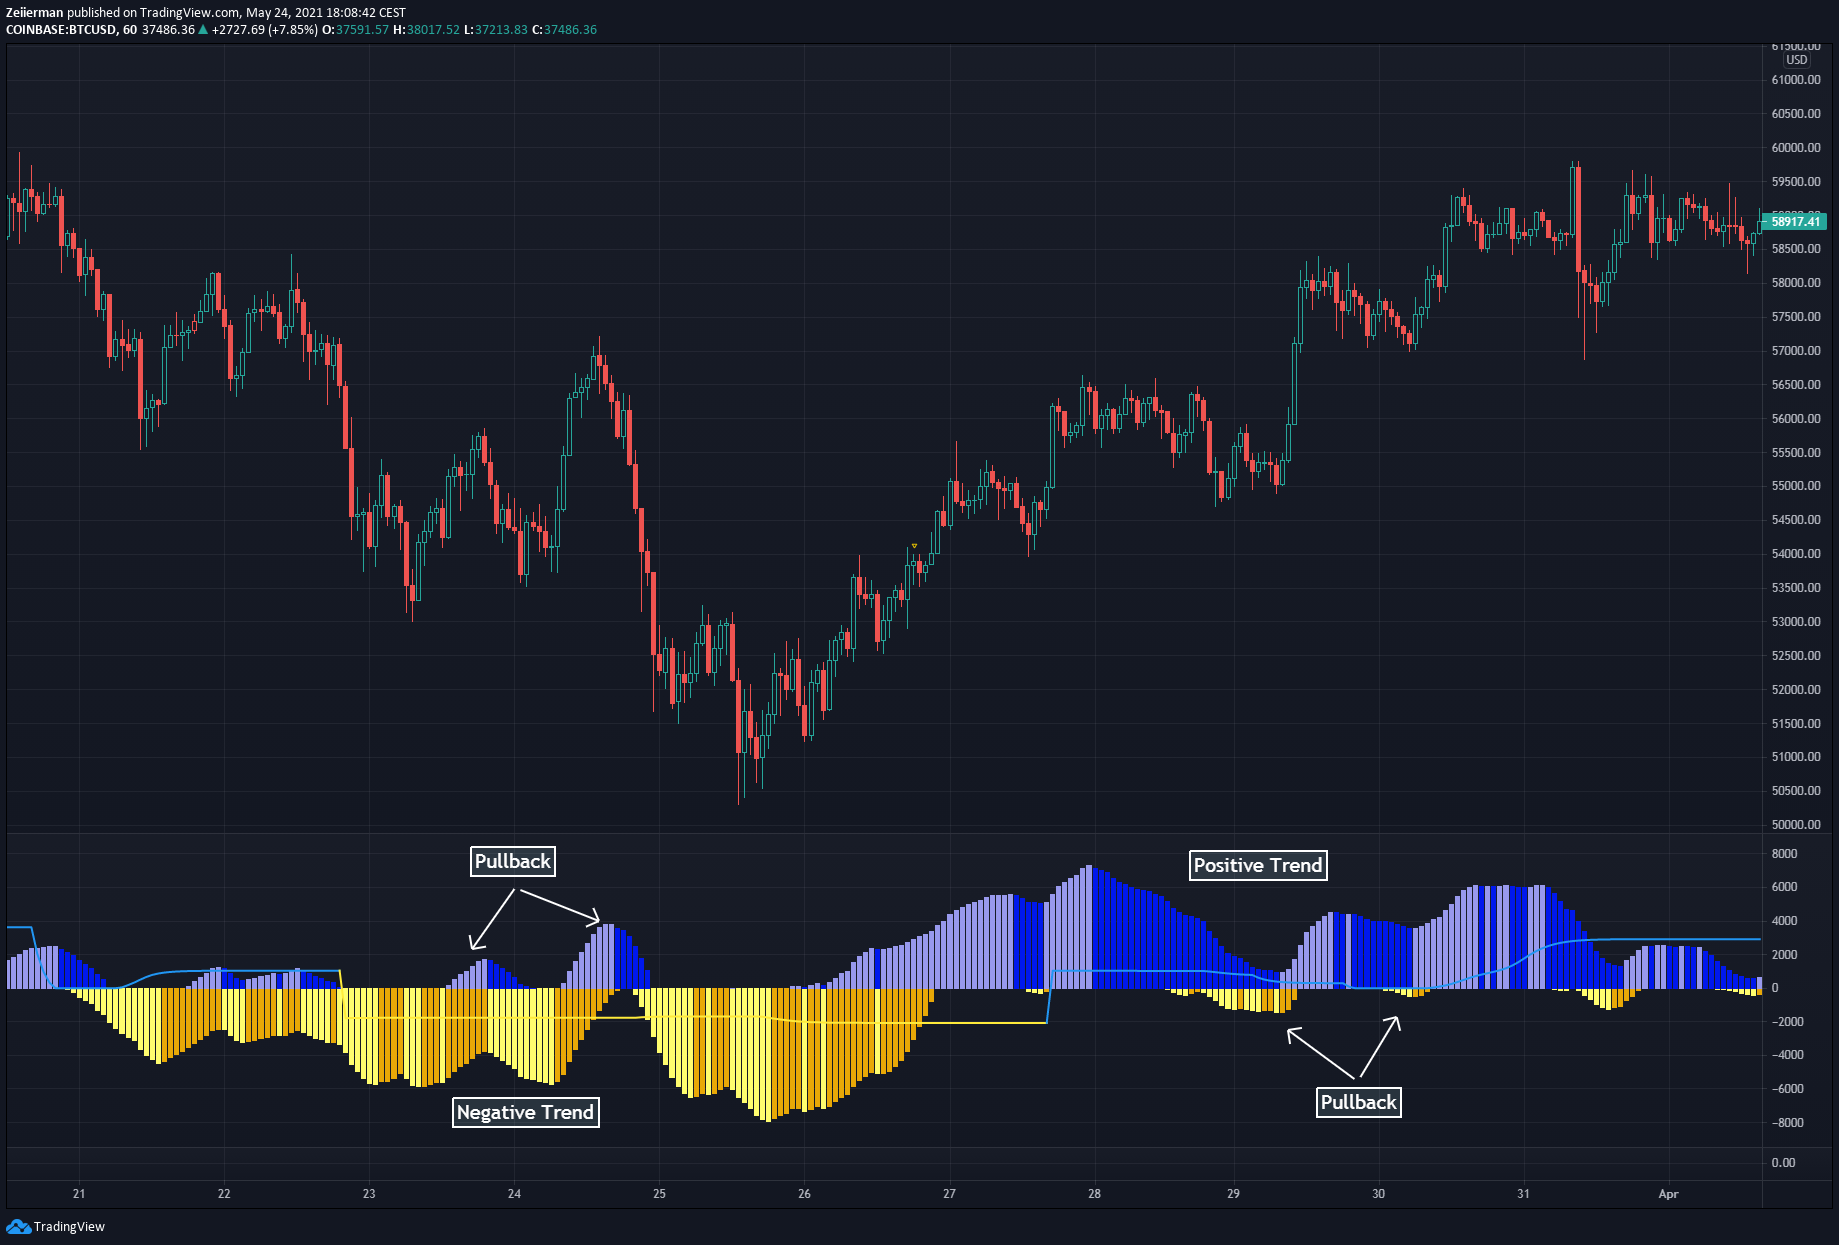
This strategy is developed by our professional trader SM Trader. He is using this strategy on a daily basis with a win rate above 80 %. This strategy is a trend-following strategy that can be used in any market and time frame. The strategy aims to identify pullbacks within a trend.
Note: We recommend using proper risk and money management such as position sizing, stop losses, etc.
This strategy aims to find pullbacks in trends. Super simple to follow and understand. It’s a must-have strategy for all traders that want to have a profitable Trend setup. Works in any market and timeframe.
The market moves in waves, Trend Waves, Swing Waves, Scalping Waves, Micro Waves, etc. The height of a wave is a measure of how strong that wave was. A strong wave can either be a sign of a trend reversal or the very first impulse that triggers a new trend. This indicator has the ability to display both positive and negative waves at the same time which can help us to find pullbacks within a bigger Trend Wave.
WaveTrend Setting
In this example, we are using Standard settings.
If you feel that the standard settingsdon’t fit your style we recommend you to play around with the Wave Transitionparameter.
Try:
- Wave Transition: 1
- Wave Transition: 10
- Wave Transition: 50
See the difference in the slideshow below.
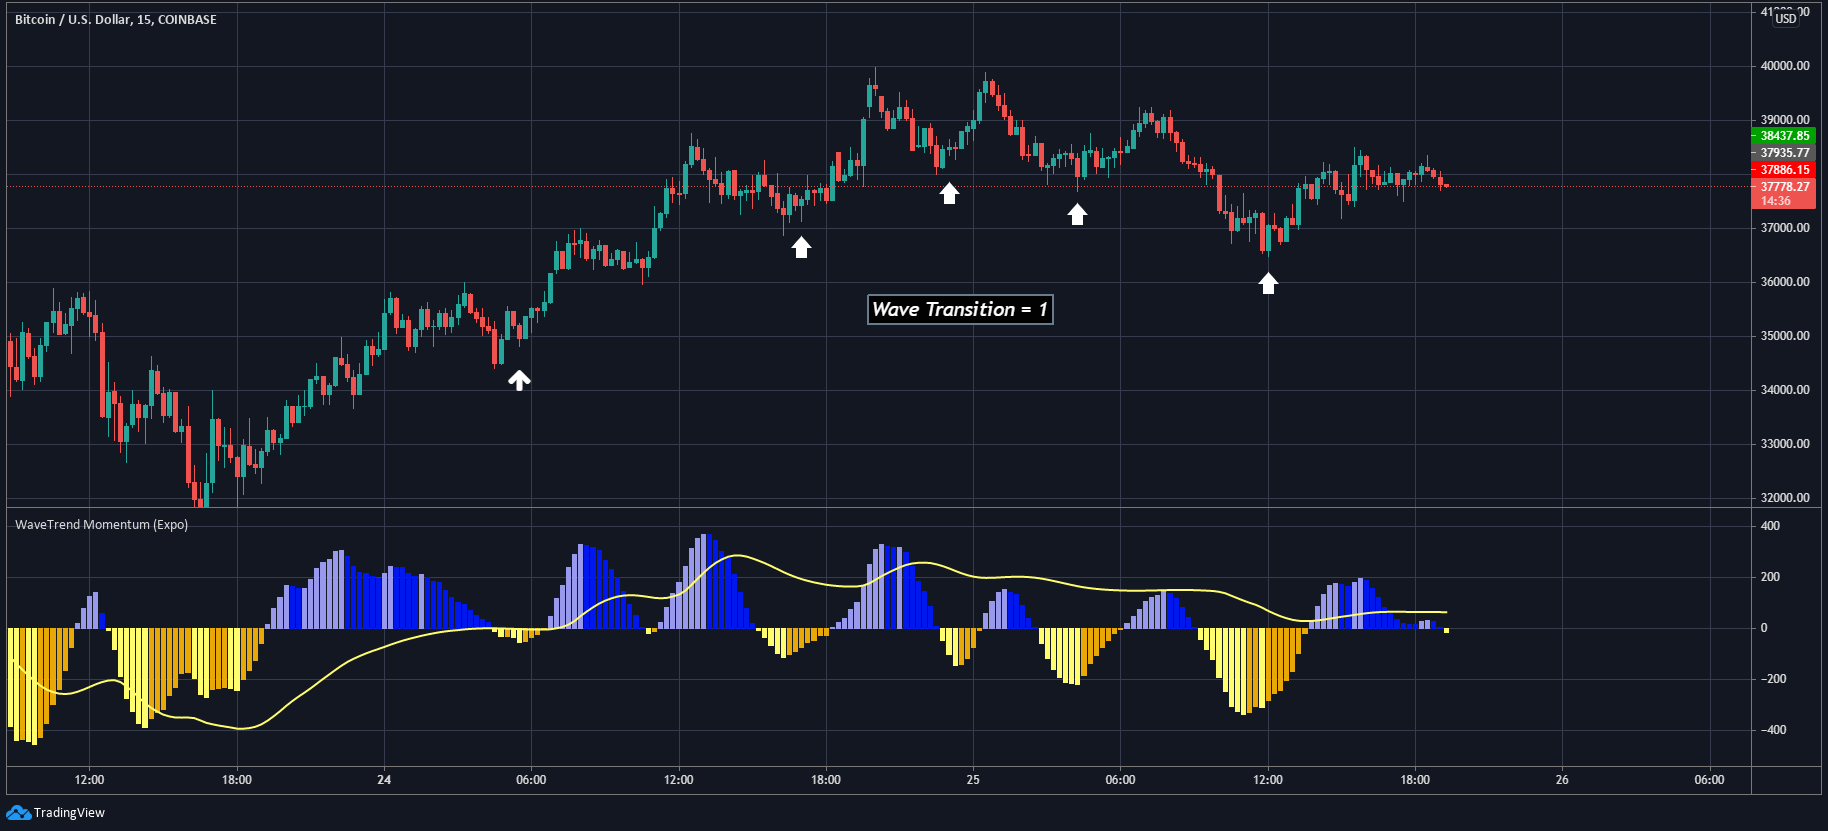
With the settings above your chart should look like this!
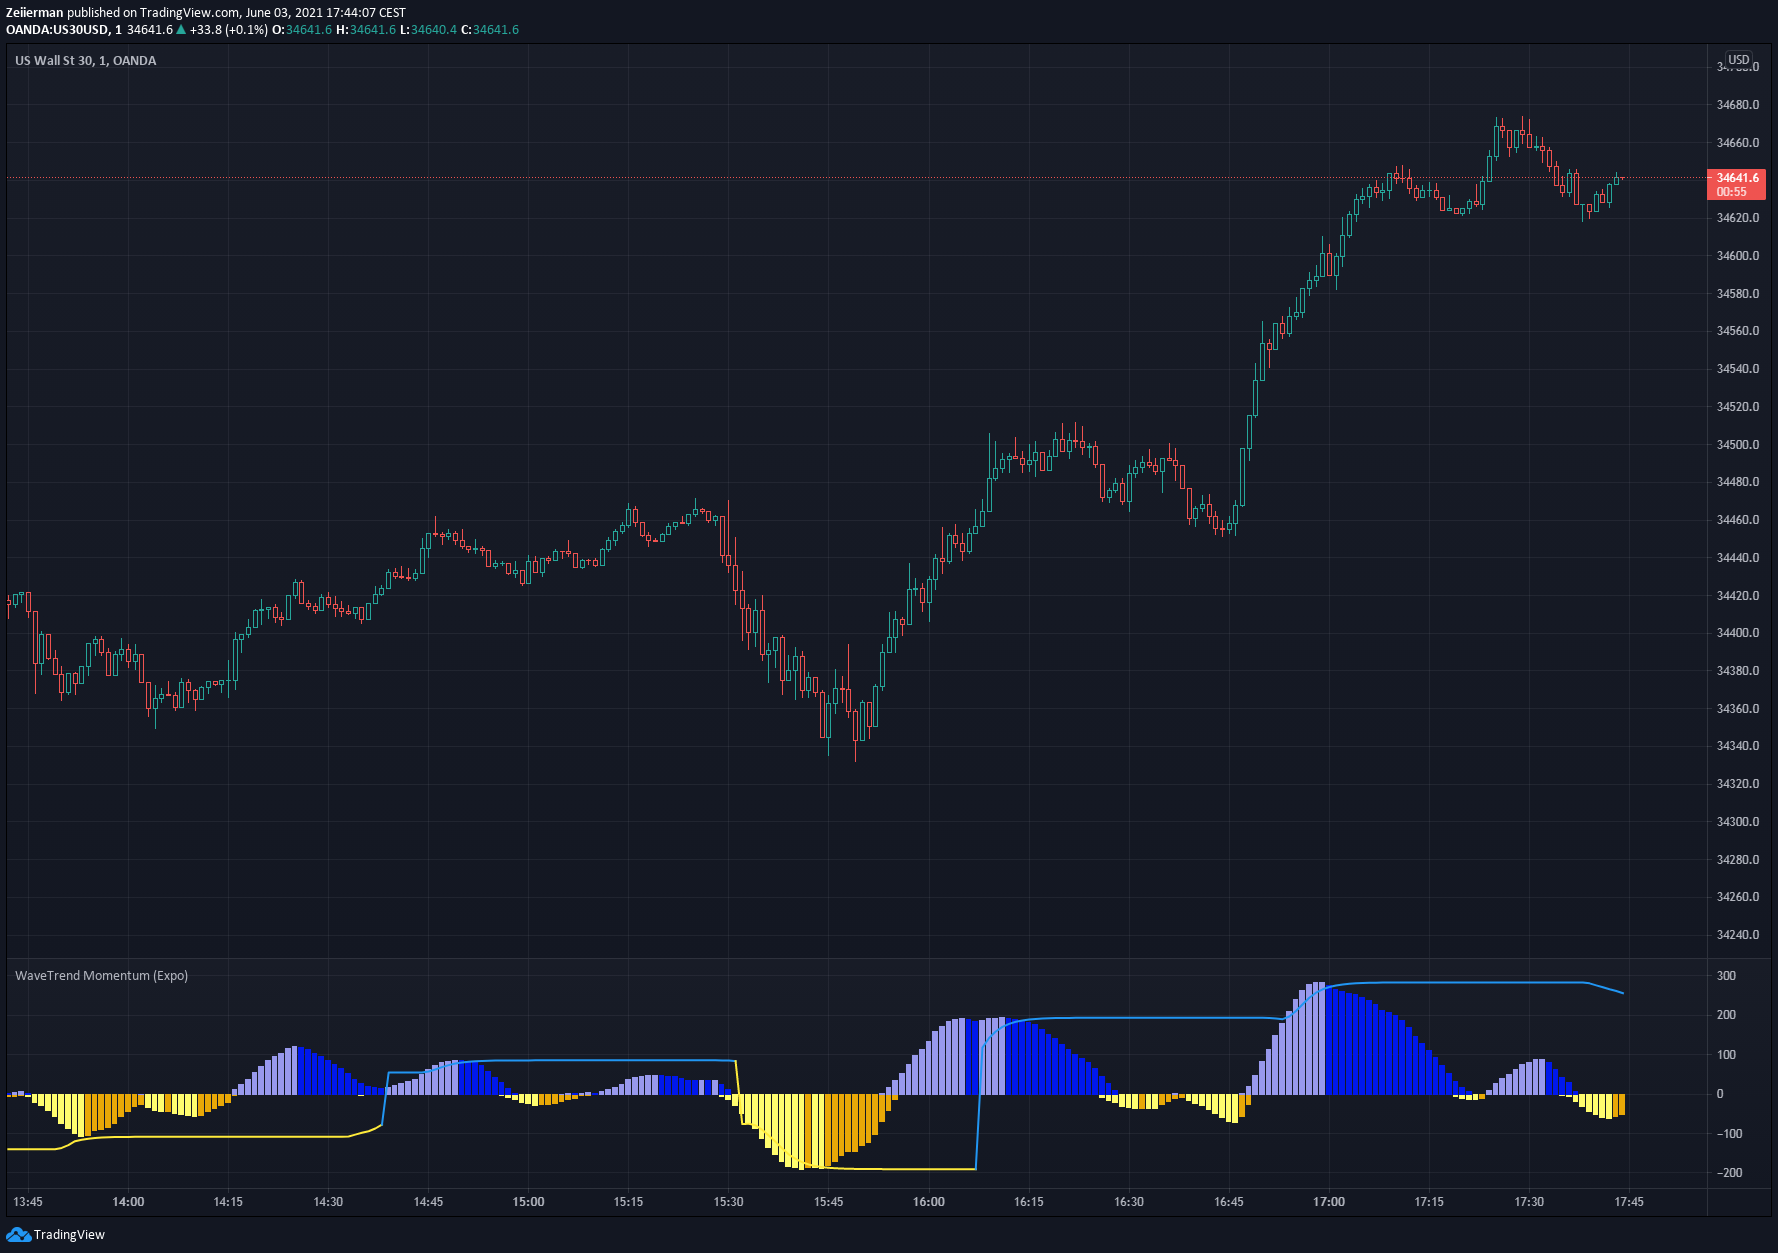
Entry
The Entry condition is based on a trend following pullback system using short-term waves combined with long-term waves.
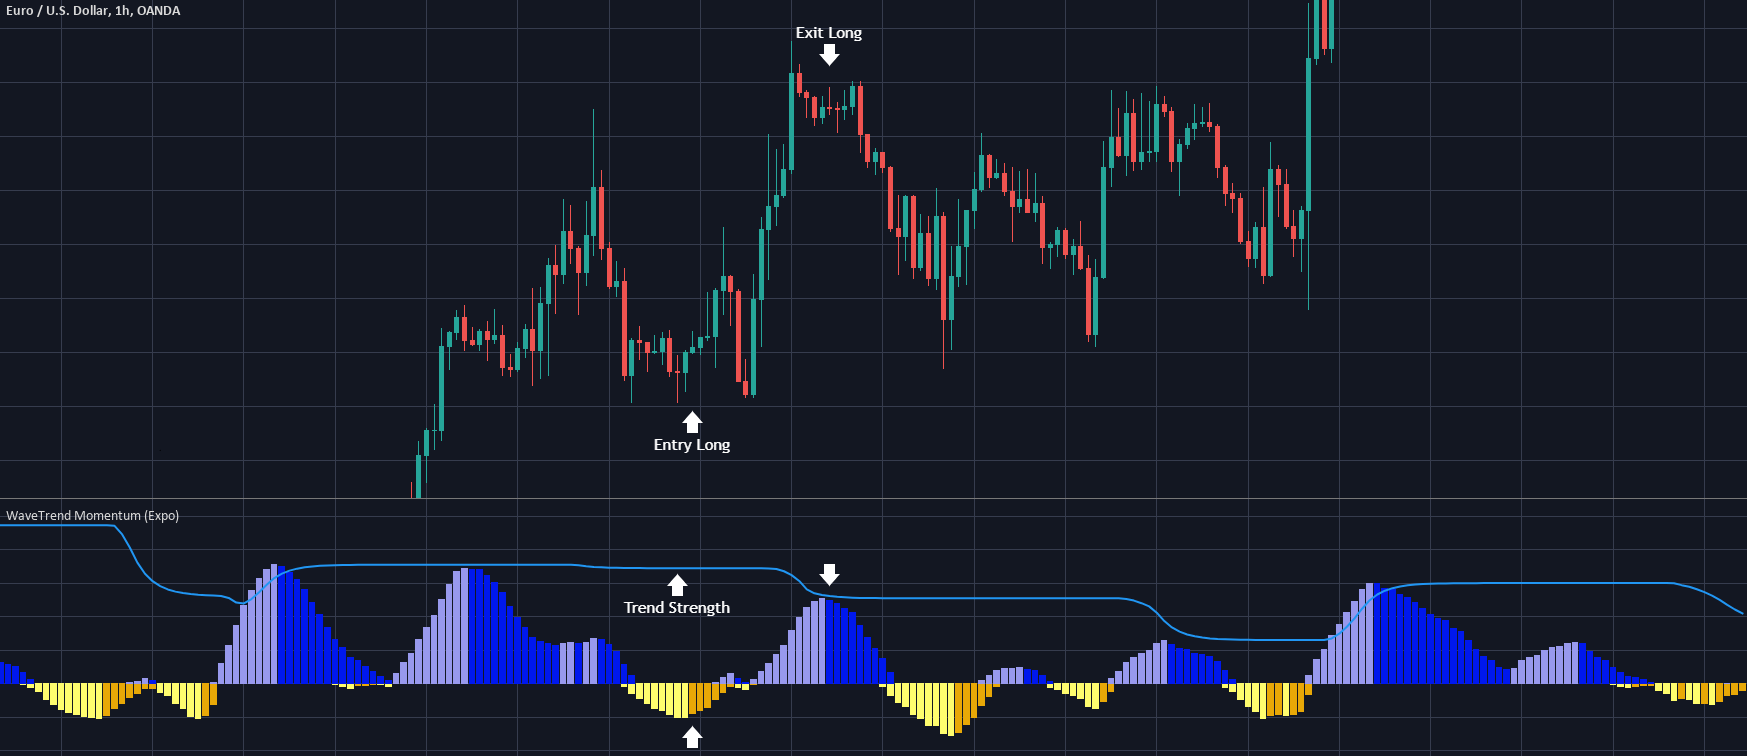
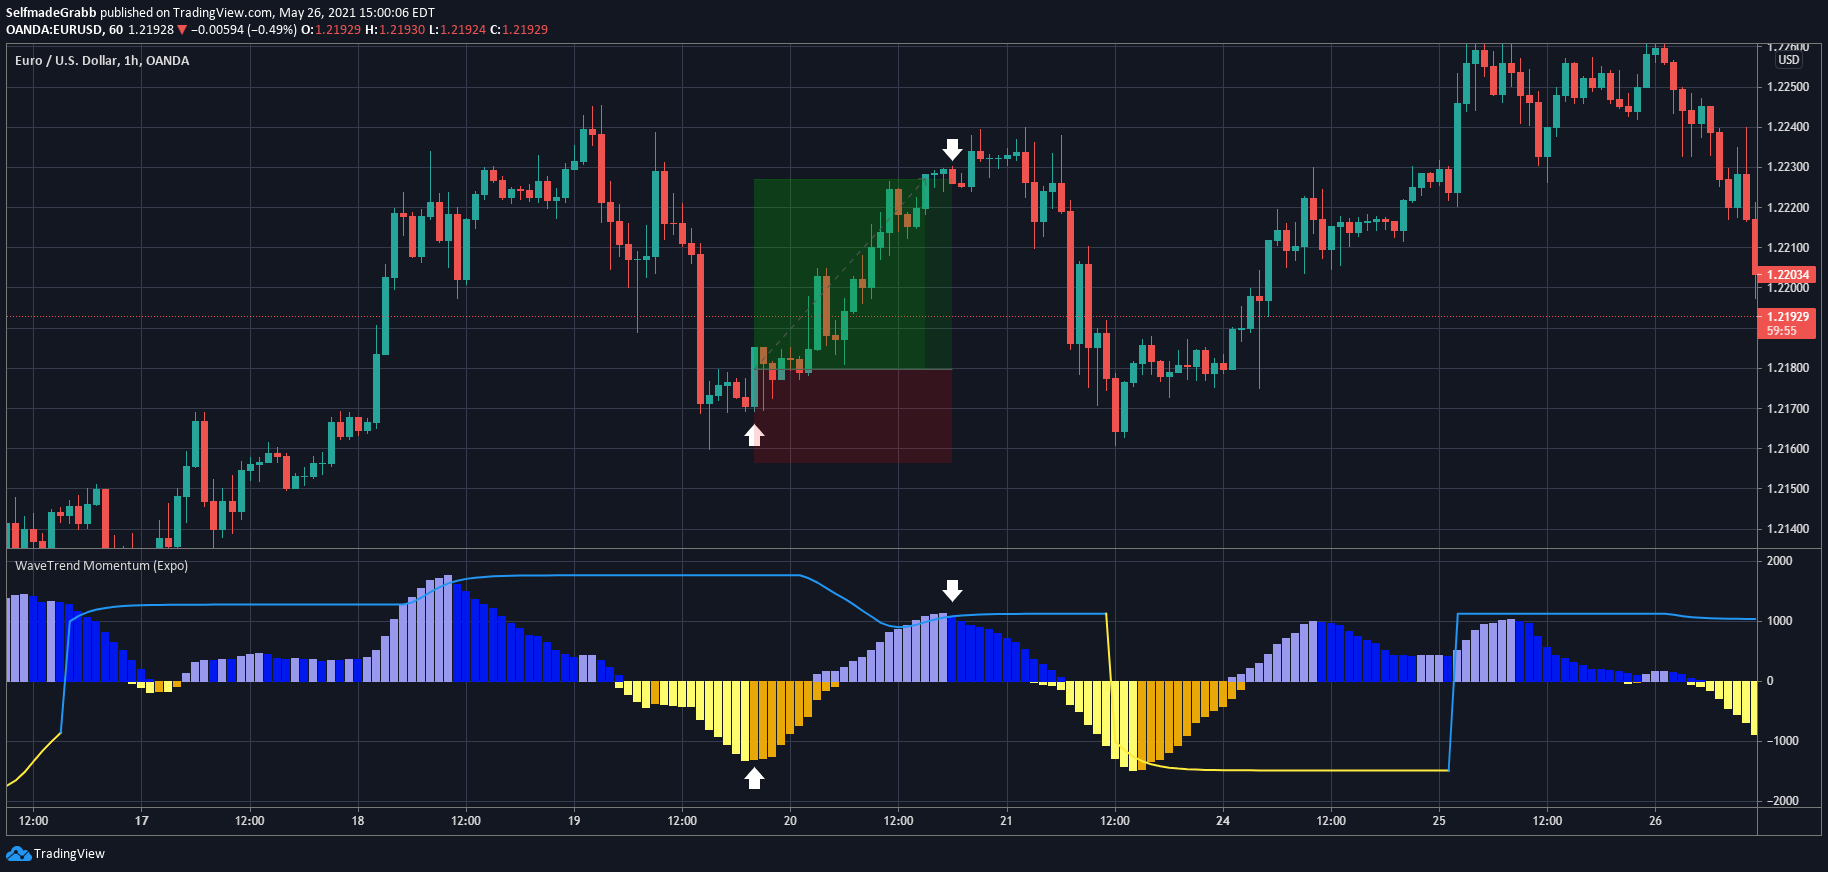
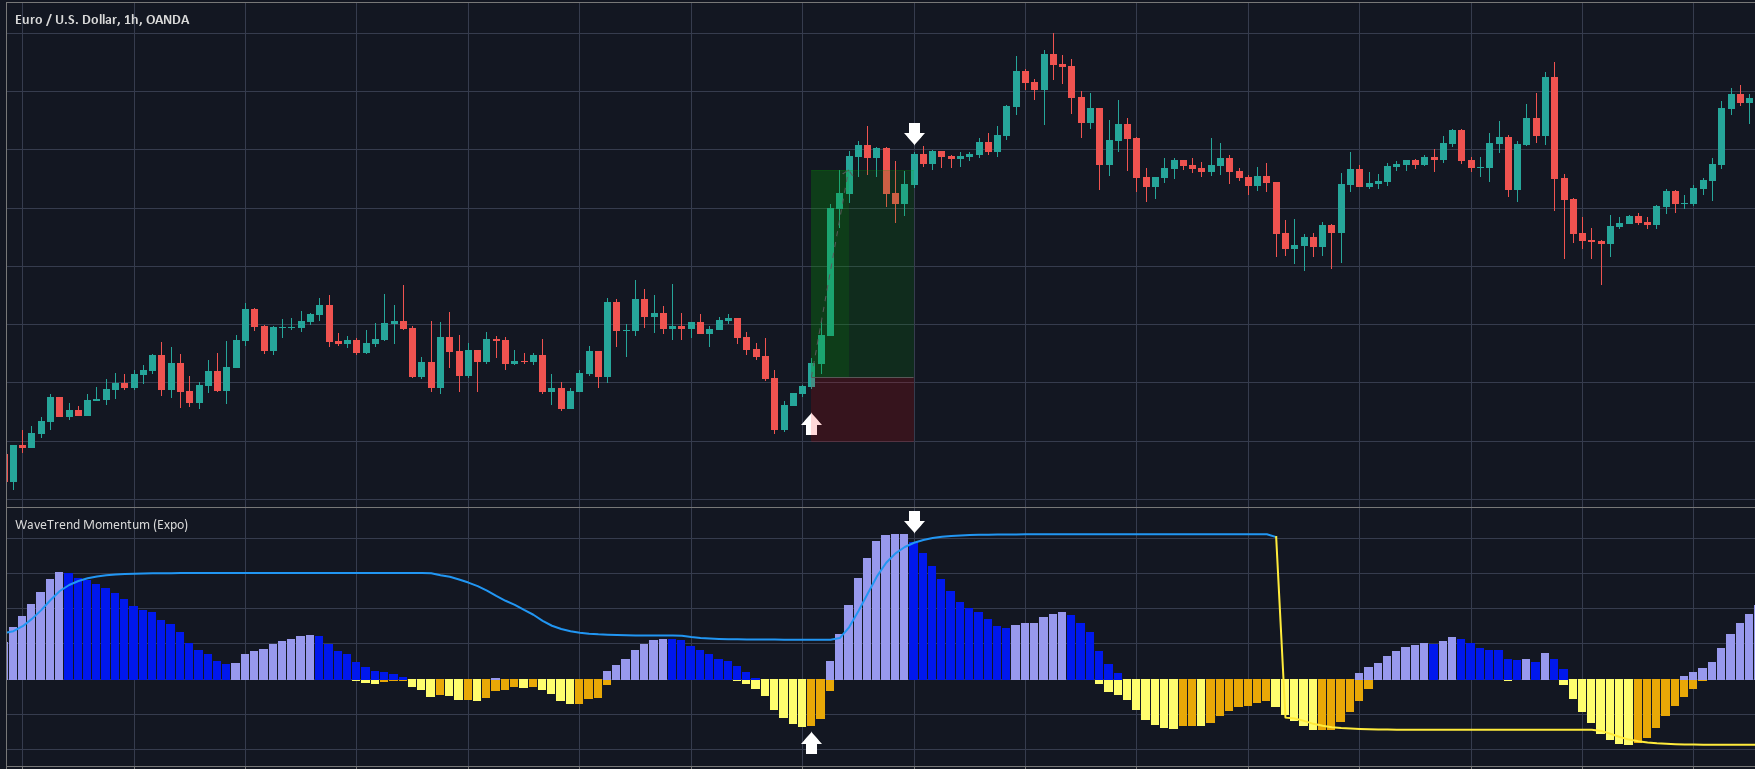
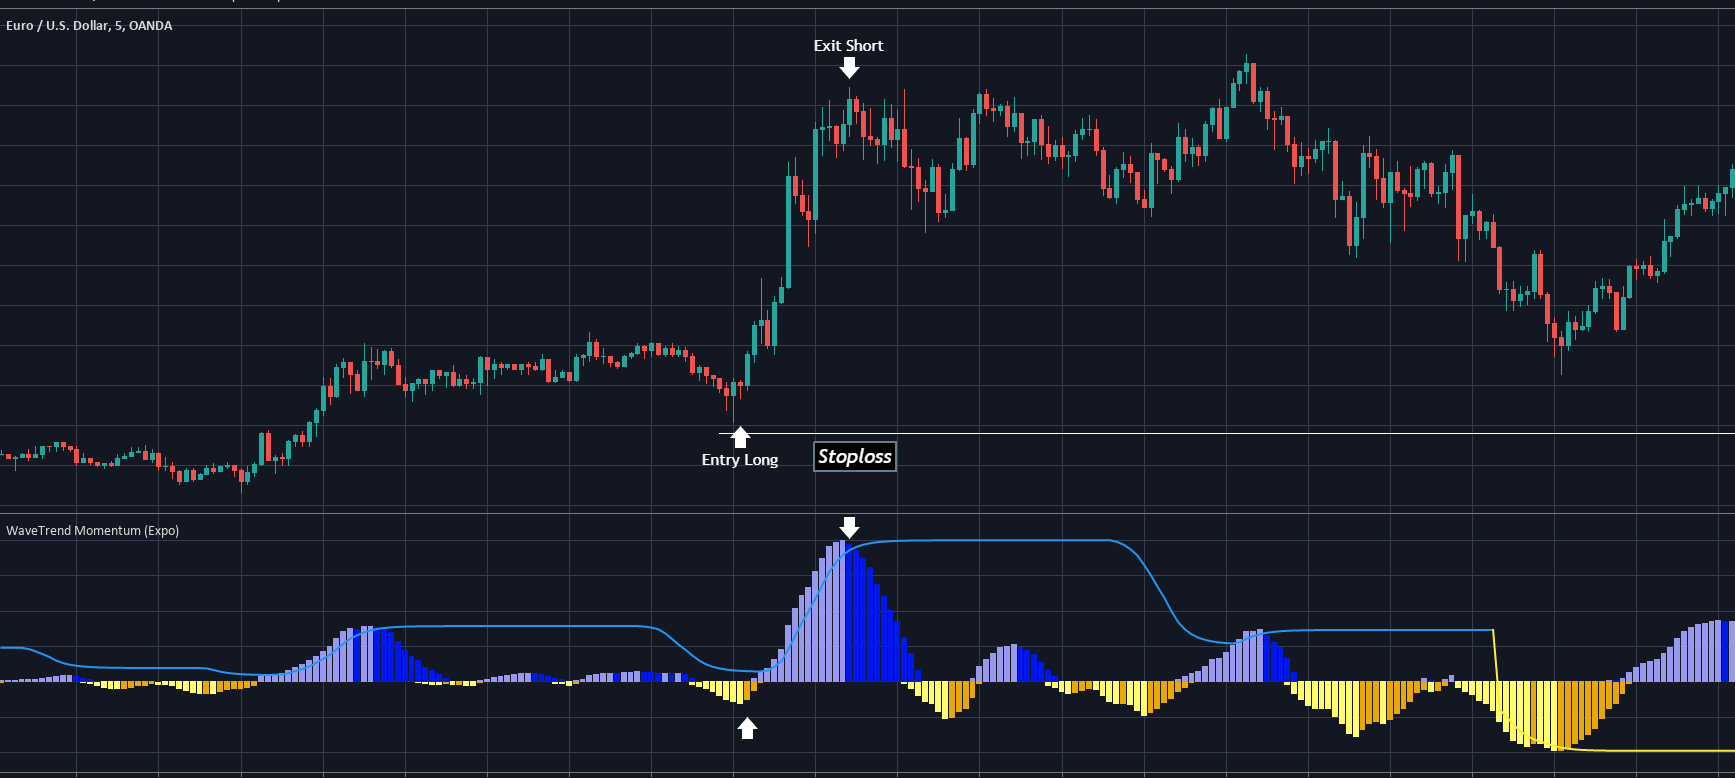
Long Entry
- The Yellow WaveTrend has to be Below the value 0.
- The Trend Strength line has to be Above the value 0.
- Enter Long when the Yellow WaveTrend starts to increase (shifting from declining to increasing)
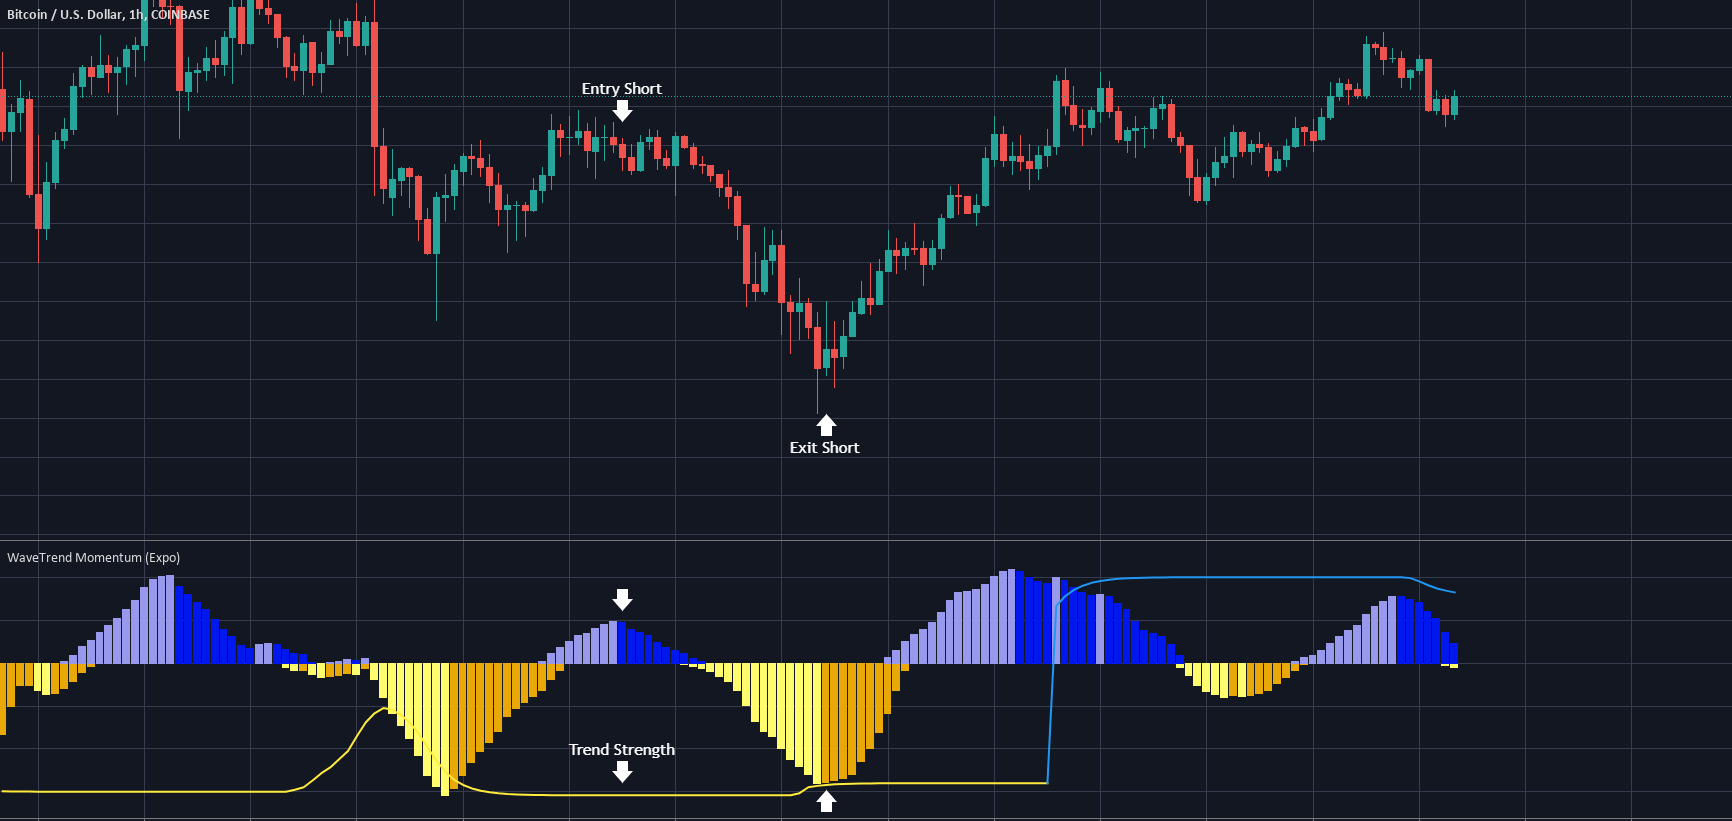
Short Entry
- The Blue WaveTrend has to be Above the value 0.
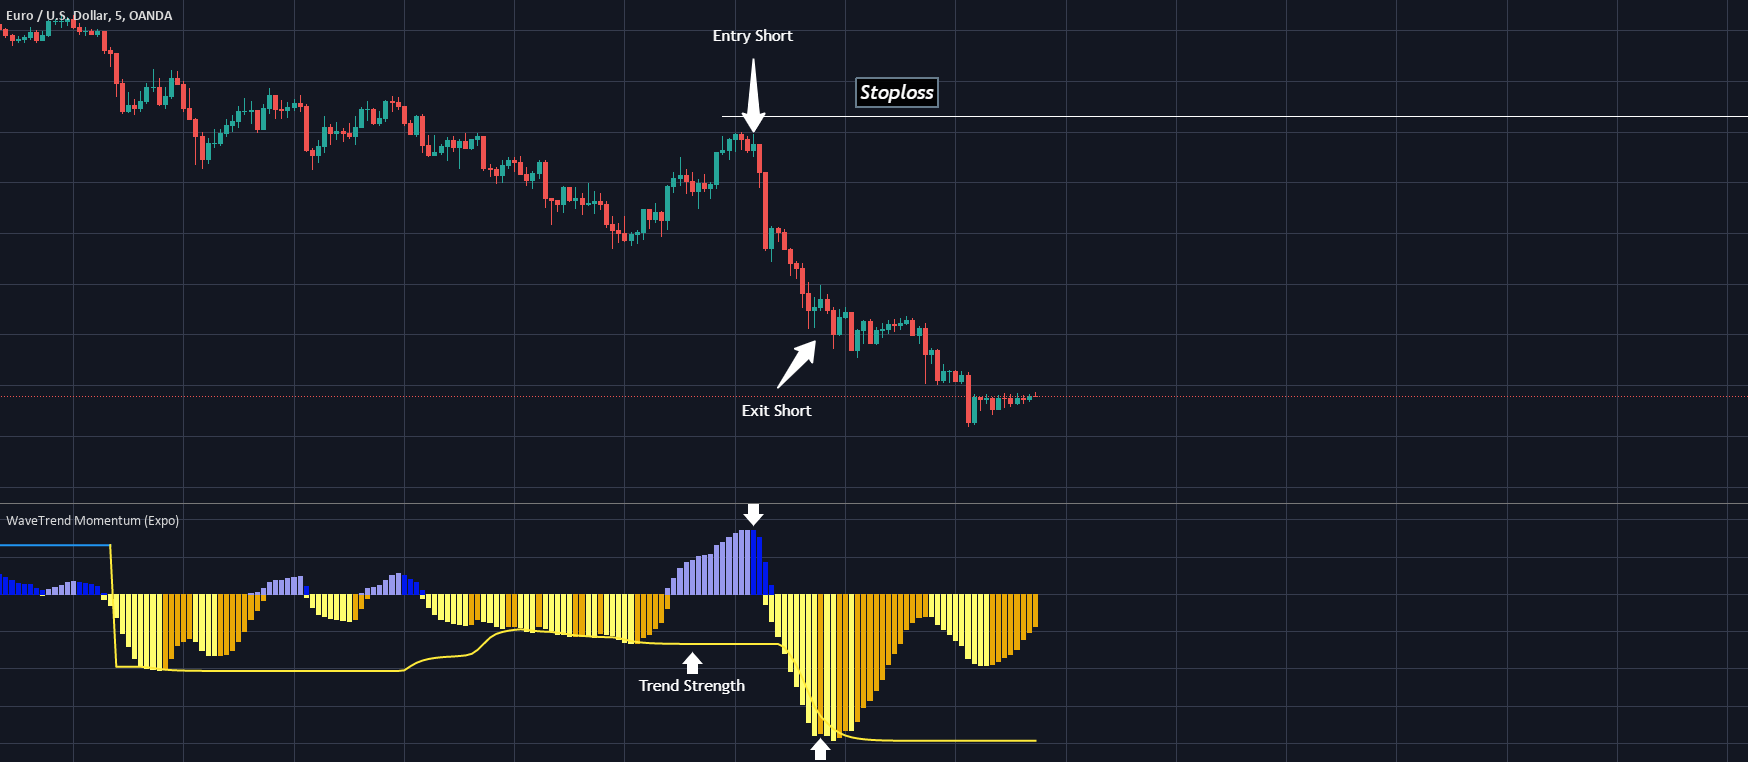
- The Trend Strength line has to be Below the value 0.
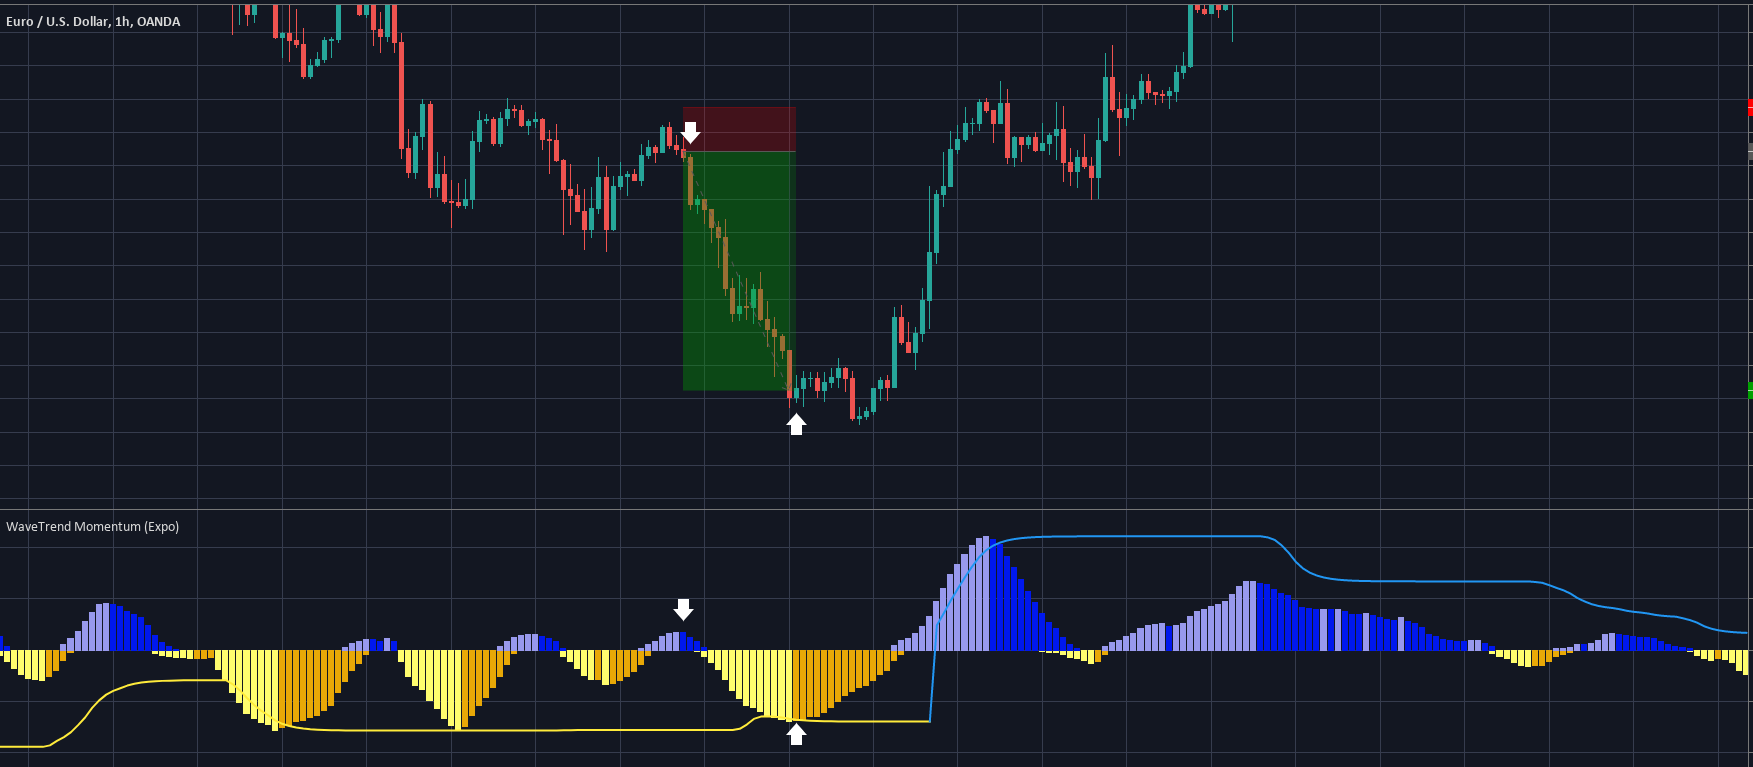
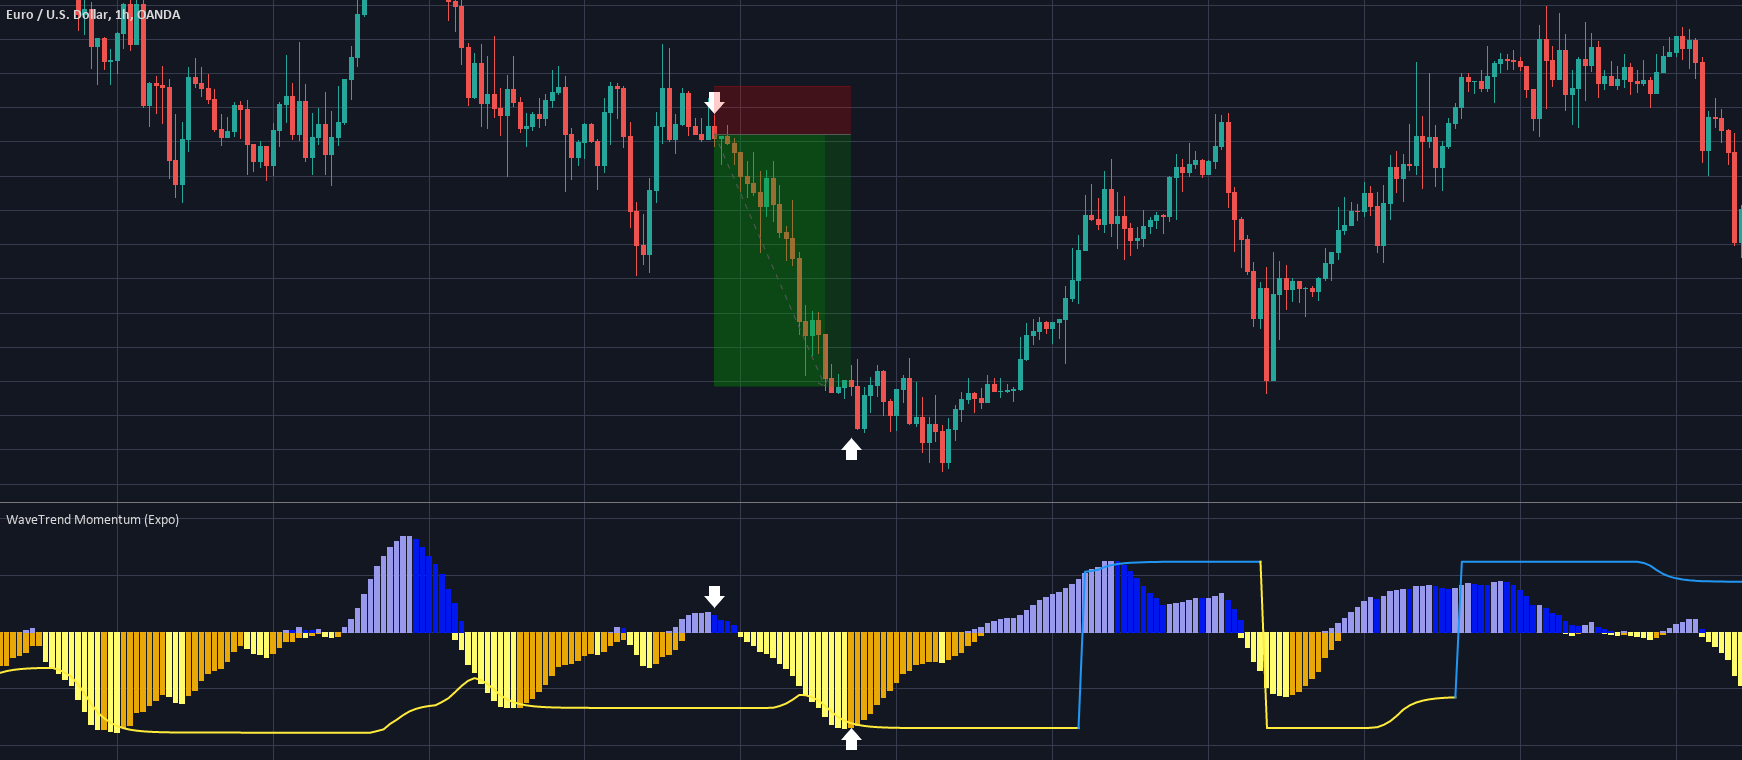
- Enter Short when the Blue WaveTrend starts to decline (shifting from increasing to declining)
Exit and Stop Loss
We recommend exiting your positions in 2steps, first, we bank some profit when the WaveTrend shifts color and make afull exit at the conditions below.
Take Profit
Take Profit Long – When the Blue Wave Trend starts to decline.
Take Profit Short – When the Yellow Wave Trend starts to increase.
Exit Position
Exit Long –The Blue WaveTrend is above/near the Trend Strength line then Exit your longwhen the Blue Wave Trend starts to decline.
Exit Short –The Yellow WaveTrend is below/near the Trend Strength line then Exit your shortwhen the Yellow Wave Trend starts to increase.
Stop Loss
Long Stop-loss – Lowest low minus some pips to give the trade some space
Short Stop-loss – Highest high plus some pips to give the trade some space
Example: Long Entry
Example: Short Entry
We hope that you gonna find this strategy valuable! If you have any questions or suggestions on how to make it even better please let us know!
