Works on the Following Platforms
TradingView
For use on the TradingView platform
The Dynamic Trailing (Zeiierman) indicator is designed to enhance the traditional SuperTrend approach by providing a more nuanced, adaptable tool for trend analysis and market volatility assessment. It combines multiple techniques to identify dynamic support and resistance levels, trend directions, and market volatility.
How the Dynamic Trailing Works
The indicator integrates several key components:
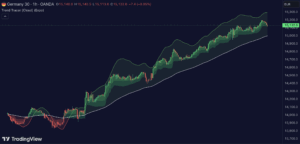
- Supertrend Calculation: Combines the Average 1 Range (ATR) with user-defined multipliers to plot potential trend directions. This helps in identifying uptrends or downtrends and visualizes potential reversals.
- TEMA Calculation: Uses the Triple Exponential Moving Average (TEMA) through a Hull Moving Average (HMA) to smooth out price data, reducing market noise and clarifying the trend direction.
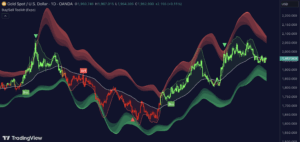
- Dynamic Support and Resistance: Calculates dynamic levels by applying deviations (derived from ATR and multipliers) to the smoothed price data, which adapt to market conditions.
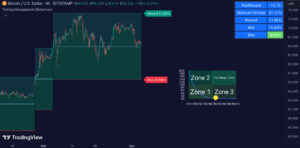
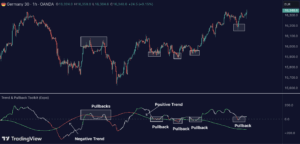
- Trend and Cloud Calculation: Plots a ‘Cloud’ zone around the trend direction, adjusting in width based on ATR and user-defined settings, indicating the strength and stability of the current trend.
Usage of the Dynamic Trailing
Traders can utilize this indicator in several ways:
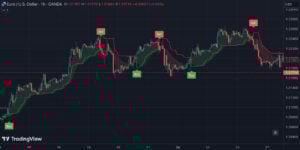
- Trend Identification: The indicator helps quickly identify the prevailing market trend. Changes in the color of the dynamic trailing line or its position relative to the price can signal potential trend reversals.
- Dynamic Support and Resistance: Unlike static levels, the dynamic levels adjust with market conditions, providing current areas where the price might experience support or resistance, which are essential for making informed trading decisions.
Features of the Dynamic Trailing
Key features include:
- Multiplier (Mult): Adjusts the ATR calculation’s multiplier, affecting the deviation distance for support and resistance levels. Higher values decrease sensitivity and vice versa.
- Length (Len): Sets the period for the HMA in the TEMA calculation, influencing the indicator’s responsiveness to price changes.
- Smoothness: Determines the smoothness of the dynamic support and resistance lines by setting the Simple Moving Average (SMA) length. Higher values result in smoother lines.
- Cloud Width: Modifies the width of the cloud, providing a visual representation of market volatility.
- Color Settings (upcol and dncol): Customizes the colors of the indicator’s lines and cloud, aiding in visual trend identification.
Conclusion
The Dynamic Trailing (Zeiierman) indicator is a versatile tool for traders looking to incorporate dynamic trend and volatility analysis into their strategies. By providing real-time adjustments and multiple analytical techniques, it helps traders make more informed and strategic decisions.
Zeiierman
With over 16 years in the market, Zeiierman has extensive experience as a full-time trader and risk advisory consultant for hedge funds. He has developed many profitable trading strategies, drawing on his background in risk management and strategy execution.
More from Zeiierman