Works on the Following Platforms
TradingView
For use on the TradingView platform
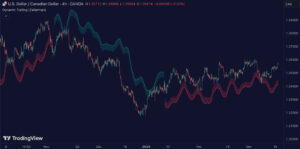
The Grid by Volatility by Zeiierman is an innovative trading indicator designed to provide a dynamic grid overlay on price charts. This grid adjusts in real-time based on market volatility, offering traders a valuable tool for analyzing price volatility patterns, identifying support and resistance levels, and making informed trading decisions.
How the Grid by Volatility Works
The indicator begins by assessing market volatility using Standard Deviation. It then calculates a central equilibrium line, or “mid-line,” on the chart. Based on this mid-line and the calculated volatility, the algorithm generates upper and lower grid lines, equidistant from the mid-line. These lines adjust dynamically to reflect current market conditions.
Usage of the Grid by Volatility
Traders can utilize this indicator in various ways:
- Trend Analysis: The grid helps analyze the underlying trend of an asset. If the price is above the mid-line and moving towards the upper range, it indicates a bullish trend. Conversely, if the price is below the mid-line and moving towards the lower range, it indicates a bearish trend.
- Support and Resistance Levels: The grid lines act as dynamic support and resistance levels. Prices often bounce off these levels or break through them, providing potential trade opportunities.
- Volatility Gauge: The distance between the grid lines measures market volatility. Wider grid lines indicate higher volatility, while narrower grid lines suggest lower volatility.
Features of the Grid by Volatility
Key features include:
- Volatility Length: Number of bars used to calculate the Standard Deviation (default is 200).
- Squeeze Adjustment: Multiplier for the Standard Deviation to adjust the sensitivity of the grid (default is 6).
- Grid Confirmation Length: Number of bars used to calculate the weighted moving average for smoothing the grid lines (default is 2).
Conclusion
The Grid by Volatility is a powerful tool for traders looking to understand and utilize market volatility in their trading strategies. By providing a dynamic and real-time grid overlay, it helps identify trends, support and resistance levels, and measure volatility effectively. Integrating this indicator into your trading toolkit can significantly enhance your market analysis and decision-making processes.
