Works on the Following Platforms
TradingView
For use on the TradingView platform
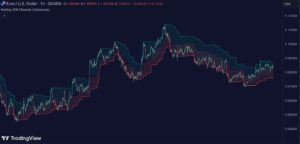
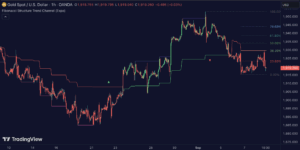
The Linear Regression Trend by Zeiierman is a powerful trading indicator designed to analyze and visualize market trends using linear regression techniques. It provides traders with essential insights into the direction and strength of market trends by calculating and displaying linear regression channels.
How the Linear Regression Trend Works
The Linear Regression Trend indicator calculates a central linear regression line based on the selected time period. It then adds upper and lower parallel lines set at a specific number of standard deviations from the central line. This forms a channel that helps identify the overall trend and volatility of the market. The central line represents the trend direction, while the parallel lines indicate potential support and resistance levels based on market volatility.
Usage of the Linear Regression Trend
Traders can use this indicator in various ways:
- Trend Identification: The central linear regression line helps in identifying the primary market trend.
- Support and Resistance Levels: The parallel lines act as dynamic support and resistance levels, aiding in entry and exit decisions.
- Overbought and Oversold Conditions: When prices move significantly away from the central line, they may indicate overbought or oversold conditions, signaling potential reversal points.
- Trend Continuation and Reversals: By observing price interactions with the linear regression channel, traders can gauge whether the current trend is likely to continue or reverse.
Features of the Linear Regression Trend
Key features of this indicator include:
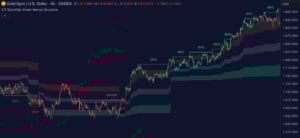
- Real-Time Calculation: The indicator updates in real-time to reflect current market conditions.
- Customizable Parameters: Users can adjust the period length and the number of standard deviations to fine-tune the channel according to their trading strategy.
- Alerts: The indicator can be set to trigger alerts when prices cross the upper or lower channels, helping traders stay informed of significant market movements.
- Visual Clarity: Color-coded channels and lines make it easy to interpret market data and identify trends and potential reversal points quickly.
Conclusion
The Linear Regression Trend is a versatile tool for traders looking to enhance their market analysis by incorporating linear regression techniques. Its ability to identify trends, support, and resistance levels, and potential reversal points makes it a valuable addition to any trader’s toolkit. By integrating this indicator into their trading strategy, traders can make more informed decisions and improve their overall trading performance.
Zeiierman
With over 16 years in the market, Zeiierman has extensive experience as a full-time trader and risk advisory consultant for hedge funds. He has developed many profitable trading strategies, drawing on his background in risk management and strategy execution.
More from Zeiierman