Works on the Following Platforms
TradingView
For use on the TradingView platform
The RSI Signal is a robust trading indicator designed to enhance your market analysis by utilizing the Relative Strength Index (RSI). It provides clear signals and customizable options to fit various trading strategies.
How the RSI Signal Works
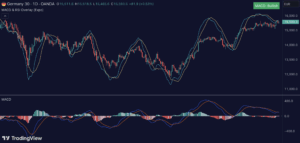
This indicator primarily relies on the RSI, a momentum oscillator that measures the speed and change of price movements. The RSI oscillates between zero and 100, typically identifying overbought conditions above 70 and oversold conditions below 30. The RSI Signal (Expo) incorporates these readings to generate trading signals and identify potential market reversals.
Usage of the RSI Signal
Traders can employ the RSI Signal for:
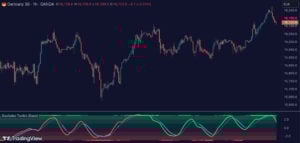
- Scalping: Enter long positions when the RSI signal turns green and short positions when it turns red. Exit positions when the signal color changes or crosses the long moving average.
- Swing Trading: Monitor the RSI signal relative to the long moving average to identify longer-term trends. Look for long positions when the signal is above the moving average and short positions when below.
Features of the RSI Signal
Key features of the RSI Signal include:
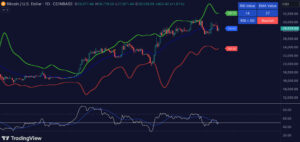
- Visual Cues: Green and red ribbons indicating bullish and bearish conditions.
- Trend Confirmation: Integration of a long moving average to validate trend directions.
- Customizability: Users can adjust the RSI source, length, smoothing parameters, and moving average settings.
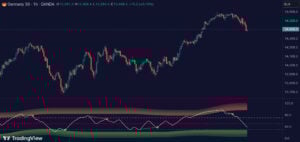
- Divergence Detection: Identifies bullish and bearish divergences to predict potential reversals.
- Alerts: Notifications for changes in RSI signals and moving average crossings.
Conclusion
The RSI Signal is a powerful tool for traders seeking to leverage RSI insights for better market timing and trend identification. Its flexibility and visual aids make it suitable for both short-term scalping and longer-term swing trading. Integrating this indicator with other analysis tools can enhance trading decisions and strategy effectiveness.
Zeiierman
With over 16 years in the market, Zeiierman has extensive experience as a full-time trader and risk advisory consultant for hedge funds. He has developed many profitable trading strategies, drawing on his background in risk management and strategy execution.
More from Zeiierman