Works on the Following Platforms
TradingView
For use on the TradingView platform
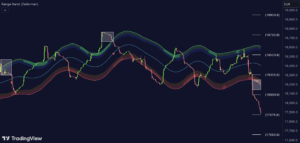
The TrendCylinder by Zeiierman is a dynamic trading indicator designed to capture trends and volatility in an asset’s price. It provides traders with a visualization of the current trend direction and dynamically adjusting upper and lower bands based on market volatility. This helps identify potential breakouts and support/resistance levels, enhancing trading strategies by incorporating both trend-following and volatility-based metrics.
How the TrendCylinder Works
The TrendCylinder calculates a central trend line using closing prices and volatility metrics such as Standard Deviation and Average 1 Range (ATR). The upper and lower bands adjust dynamically based on these metrics, providing a flexible representation of potential price movements. The trend line reacts to sudden price changes according to the trend factor and trend step settings.
Usage of the TrendCylinder
Traders can utilize this indicator in several ways:
- Identifying Trends: The trend line indicates the market trend. A price above the trend line signifies a bullish trend, while a price below indicates a bearish trend.
- Dynamic Support and Resistance: The upper and lower bands act as moving support and resistance levels, adjusting with market volatility to provide more accurate stop-loss and take-profit levels.
- Breakout vs. Reversion Strategies: Movements beyond the bands suggest strong trends suitable for breakout strategies. Conversely, if the price touches a band and reverses, it might indicate a fakeout, which can be traded against the breakout.
Features of the TrendCylinder
Key features include:
- Volatility Period: Defines the look-back period for calculating volatility. Higher values make the bands adjust more slowly, while lower values make them more responsive.
- Trend Factor: Adjusts the sensitivity of the trend line. Higher values produce smoother lines, while lower values make it more reactive to price changes.
- Trend Step: Controls the rate at which the trend line adjusts to sudden price movements. Higher values lead to slower adjustments and smoother lines, while lower values result in quicker adjustments.
Conclusion
The TrendCylinder is a versatile tool that combines trend and volatility analysis to enhance trading decisions. Its dynamic bands and trend line provide real-time insights into market conditions, helping traders identify trends, support/resistance levels, and potential breakout or fakeout scenarios. Integrating this indicator into your trading toolkit can significantly improve your market analysis and trading strategy.
Zeiierman
With over 16 years in the market, Zeiierman has extensive experience as a full-time trader and risk advisory consultant for hedge funds. He has developed many profitable trading strategies, drawing on his background in risk management and strategy execution.
More from Zeiierman