Works on the Following Platforms
TradingView
For use on the TradingView platform
What is Volatility
Volatility can be referred to many things, but a commonly accepted definition of volatility is that it measures the risk or uncertainty in the market. Higher volatility is equal to more risk in the market. A simple way of describing it is that when volatility is high, the value of the market can be spread out over a more extensive range of values.
This means that the price of the market can change dramatically over a short time in either direction. A lower volatility means that a market’s value does not fluctuate dramatically and tends to be steadier. However, how to calculate and apply volatility has been widely debated, and many different calculations have been used. This Volatility Index is derived from research on volatility.
How to use Volatility Index
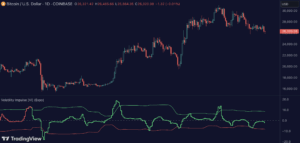
Use the indicator to identify when the volatility peaks. The volatility peaks can indicate that the market will shift. The Volatility Index indicator is a powerful tool for all traders, more suitable for contrarian traders that aim to enter long at the bottoms and take short trades at the tops. Trend traders can look at the long-term market trend and take advantage of the volatility peaks to enter when the market makes significant pullbacks. Short-term trend traders can enable the aggressive finder to find more minor market pullbacks.
- Volatility peaks can also be excellent take-profit areas.
- Identify structural market changes: when volatility increases unusually(abnormal) in relation to previous periods, structural change is happening in the market.
Volatility Index Features
The trader can select different timeframes for the indicator.
Peak Sensitivity changes the sensitivity in the volatility calculation. The difference between a higher value is that the indicator will show more volatility peaks in the market.
Smoothing Finder smoothes the volatility calculations. If activated, it usually shows more market volatility peaks.
Aggressive Finder gives a faster calculation response. By activation, the indicator becomes more aggressive and finds more volatility peaks. The user can change the aggressiveness by adjusting the setting. A lower value returns aggressive calculation, and a high value returns less aggressive calculation.
The Volatility Alert setting plots triangles on the indicator peaks. These triangles are also where the alert is triggered.


